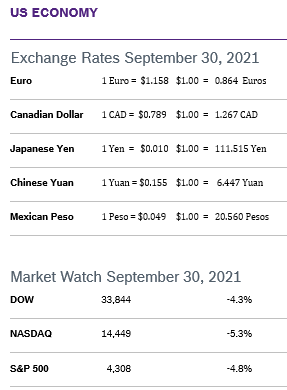
 September and October are often volatile months for the markets. All three indexes finished September in the red, with the markets having their worst overall performance since last March. Worries about inflation, potential government shutdowns and defaults, tax legislation, the ongoing pandemic, supply chain problems and shortages and property problems in China all gave the markets the jitters. Many analysts are factoring in a dip of around 5% overall but feel that most of these issues have short-term impacts but not long-term implications. For the third quarter, the Dow finished down 1.9%, the NASDAQ shed 0.3% and the S&P, the index most closely followed by analysts, was up slightly for the quarter and 15% for the year. Consumer Spending Rises 0.8% Consumer spending rose 0.8% in August after rising a downwardly revised 0.1% in July. The increase was above expectations despite continuing problems stemming from a global shortage of semiconductor chips, shortages and a pull-back in travel and other spending on services due to the spreading Delta variant. Core consumer spending rose 0.4% in August after dropping a downwardly revised 0.5% in July. Personal income gained 0.1% in August after rising 1.1% in July. An increase in Child Tax Credit payments from the government was offset by decreases in unemployment benefits. Wages rose 0.5% amidst the continuing shortage of workers. Income edged up 0.1% and savings rate fell slightly to 9.4%. Consumer Prices Rise 0.3% The Consumer Price Index (CPI) rose 0.3% in September for the second consecutive month and was up 5.3% year over year. Core inflation, which excludes the volatile food and energy categories, rose 0.3% in September after rising 0.1% in August and was up 3.6% from September 2020. Supply chain constraints and bottlenecks continue to produce shortages and price increases in many categories. The core PCE price index is the Fed's preferred measure for its 2% inflation target, which is now a flexible average. The Fed continues to believe that inflation is transitory and is focused on the employment situation. Consumer Confidence Falls to 109.3 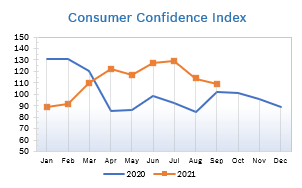
Unemployment Drops to 4.8% 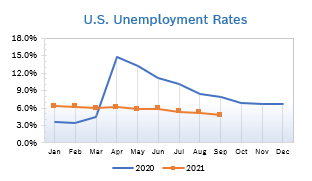
Job Openings Jump in July US job openings rose by 749,000 to 10.9 million in July, soaring to yet another record high after rising by more than 900,000 jobs in June, according to the latest Job Openings and Labor Turnover Survey (JOLTS) from the US Bureau of Labor Statistics (BLS). Job openings rose in every region. Hiring slipped by 160,00 to 6.7 million. The overall quits rate was unchanged at 2.7%, but rose to 3.1% for the private sector, which is a leading indictor of wage growth. It was once again the highest number of job openings on record and up substantially from the pandemic low of under 5 million jobs. Economists polled by Reuters had forecast job openings would rise to 10 million in July. There were just 83 workers available for every 100 job openings in July. JOLTS is a lagging indicator, but is closely watched by the Federal Reserve and factors into decisions about interest rates and other measures. Chicago PMI Falls to 64.7 The Chicago Purchasing Managers Index (Chicago PMI) fell to 64.7 in September after falling to 66.8 in August. It was the lowest reading for the index since February; however, it was also the 15th consecutive month the index remained in positive territory. Production dropped slightly to 60.7 and New Orders fell 3.4 points to 64.4, the lowest level since June. Prices Paid fell 3.2 points to a four-month low of 90.7. Companies reported fewer problems with labor, but prices remained an issue. The special question for the month asked whether respondents had modified their supply chain strategy to deal with potential problems caused by the Delta variant. The majority (52.8%) said they had made alterations and adjustments. Looking back to when the series began in 1967, the PMI has ranged from 20.7 in June 1980 to 81.0 in November 1973. Wholesale Prices Rise 0.7% The Producer Price Index rose 0.7% in August after rising 1.0% in July and was up 8.3% year over year, the largest annual increase since the Labor Department began tracking inflation data in 2010. It was the eighth consecutive monthly increase in wholesale prices. Core inflation, which excludes the volatile food and energy categories, rose 0.1% in August after rising 1.0% in July and was up just 4.0% from August 2020. That marked a big slowdown from the 6.2% annual increase in July. Both the monthly and annual increases were below market expectations. Q2 GDP Grows 6.7% GDP grew 6.7% in the second quarter, up from both the first reading of 6.5% growth and the second reading of 6.6%, according to the third and final reading from the Commerce Department. Consumer spending grew at an upwardly revised 12% annualized rate, the fastest expansion since third quarter 2020 when the economy began to reopen. Business equipment investment was also up a solid 12.3%. Growth is estimated to have slowed to around 4% in the third quarter as the country dealt with the impact of the Delta variant and the end of many government support programs. For 2021 as a whole, a panel of forecasters with the National Association for Business Economics has projected growth of 5.7%. That would mark a solid bounce-back from a 3.4% annual drop last year, when the economy was in the grips of the pandemic. It would also represent the most robust annual growth since a 7.2% surge in 1984, when the nation was emerging from a deep recession. © Robert Bosch Tool Corporation. All rights reserved, no copying or reproducing is permitted without prior written approval.
Comments are closed.
|
|