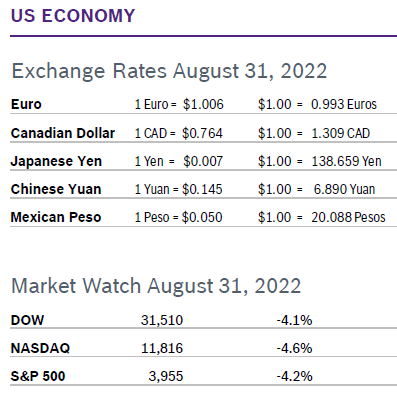
 After racking up gains early in the month, markets tumbled during the last half, spooked by the Fed’s promise of more interest rate hikes to come. It was the weakest August performance in seven years. September is typically the weakest month for the markets. Consumer Spending Inches up 0.1% Consumer spending rose just 0.1% in July after rising a robust 1.0% in June. The increase in spending was well below expectations. Core consumer spending rose 0.2% in July after being unchanged in June. Consumer incomes rose 0.2% in July after rising 0.6% in June, but wages shot up 0.8% after increasing 0.6% in June. Gas prices continued to fall in July and consumers spent more on services than they did on goods. The saving rate was unchanged at 5%, still the lowest rate since 2009. Families seem to be slowly drawing down their savings to cope with higher prices. Spending on goods dropped again and spending on services rose modestly. Consumer Prices Steady The Consumer Price Index (CPI) was unchanged in July after rising an upwardly revised 1.3% in June and was up 8.5% year over year after being up 9.1% in June. Core inflation, which excludes the volatile food and energy categories, rose 0.3% in July after rising 0.7% in June and was up 5.9% year over year for the second consecutive month. Energy prices fell, with gasoline down 7.7% but the cost of food continued to climb, rising 1.1%. Overall the prices of goods fell 0.5% while the prices of services rose 0.3%. The PCE price index fell 0.1% in July after climbing 0.6% in June and was up 6.3% year over year. Core PCE inflation rose 0.1% in July and was up 4.6% year over year. The PCE price indexes are the Fed's favored measures for their 2% inflation target. Consumer Confidence Rises to 103.2 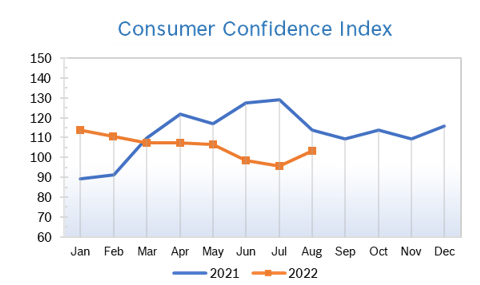
Unemployment Rises to 3.7% 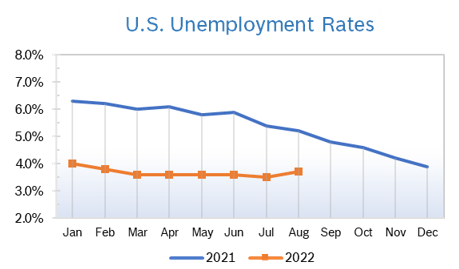
Chicago PMI Falls to 51.2 The Chicago PMI fell to 51.2 in August after falling to two-year low of 52.1 in July. Nevertheless, it was the 26th consecutive month the index has remained in positive territory. A PMI number above 50 signifies expanded activity over the previous month. Looking back to when the series began in 1967, the PMI has ranged from 20.7 in June 1980 to 81.0 in November 1973. Wholesale Prices Fall 0.5% The producer price index (PPI) fell 0.5% in July after rising 1.1% in June and was up 9.8% on a yearly basis, down from a record 11.3% year-over-year increase in June. Economists surveyed were expecting a monthly jump of 0.3% and a 10.4% yearly increase. Stripping out the volatile categories of food, energy, and trade services, the PPI increased by 5.8%, down from 6.4% in June. Q2 GDP Revised Up GDP shrank 0.6% in the second quarter rather than the 0.9% decline first reported, according to the Commerce Department’s second reading. Over the past four quarters GDP is up 1.7%. Real consumer spending was revised up to show an increase of 1.5% compared to the 1.0% gain first reported. Spending on both durable and non-durable goods fell but spending on services rose sharply. Residential investment, or housing, fell at a 16.2% annual rate in the second quarter compared to a 0.4% annualized increase in the first quarter. The drop in the second quarter subtracted 0.83 percentage points from GDP. Businesses added to inventory at an $83.9 billion annual rate (in real terms) in the second quarter versus accumulation at a $188.5 billion rate in the second quarter. The slower accumulation reduced second-quarter growth by a very sizable 1.83%. The personal-consumption price index (PCE) rose at a 7.1% annualized rate, matching the first quarter. From a year ago, the index is up 6.5%. However, excluding the volatile food and energy categories, the core PCE index rose at a 4.4% versus a 5.2% increase in the first quarter. It was the slowest pace of increase since the first quarter of 2021. From a year ago, the core PCE index is up 4.8 percent. While back-to-back quarters of negative GDP growth is typically considered a recession, many economists say that while the economy is slowing, strong job growth and consumer spending don’t indicate a wide-spread recession. Fed Sees More Rate Hikes Ahead There are more rate hikes and more pain for the average American ahead, according to Fed Chairman Jerome Powell’s much-anticipated speech at the Fed’s annual conference in Jackson Hole. Analysts now believe the Fed will continue to aggressively raise rates into 2023 to bring down inflation and cool the economy without pushing it into a recession. Three-quarters of analysts believe the Fed will raise rates by another three-quarters of a percent at their next meeting in September, a big jump from a month ago when prices began coming down and just 25% of analysts expected another big hike. Consensus shows that most expect rates to level out at about 3.5% next year. © Robert Bosch Tool Corporation. All rights reserved, no copying or reproducing is permitted without prior written approval.
|
|