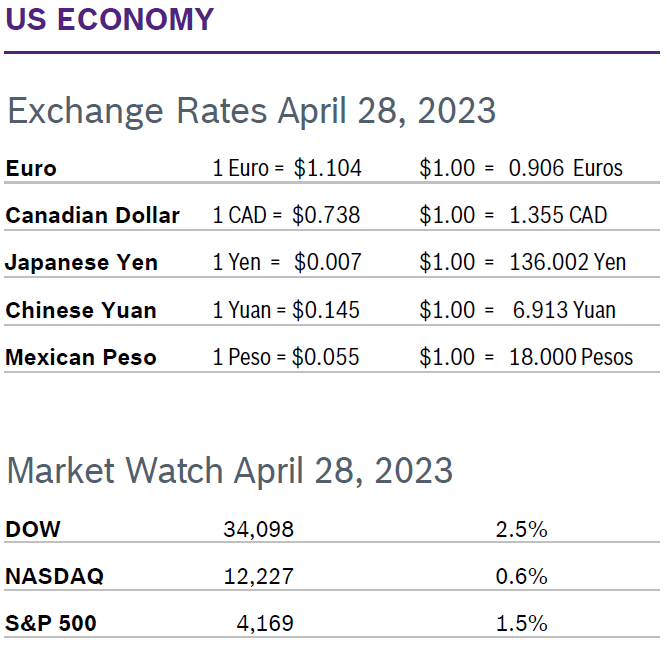
 All markets finished April in the black, with the DOW having the best month since January. The market was boosted by strong earnings from several big tech companies. The latest data showed inflation slowing and GDP indicated the economy was still growing, albeit slowly. Consumer Spending Unchanged Consumer spending was unchanged in March after inching up a downwardly revised 0.1% in February. Spending on services rose 0.4%, driven by housing and utilities as well as healthcare. Spending on goods fell 0.6% as purchases of motor vehicles, mostly new light trucks, decreased. Consumer spending was included in the first report for Q1 GDP, which showed that consumer spending surged 3.7% in the first quarter. Consumer Prices Rise 0.1% in March The Consumer Price Index (CPI) rose 0.1% in March after rising 0.4% in February. Consumer prices were up 5.0% year over year after being up 6.0% in February. It was the ninth consecutive month that year-over-year inflation has cooled down. Core inflation, which excludes the volatile food and energy categories, rose 0.4% in March after rising 0.5% in February but remained at 5.6% on an annual basis for the second consecutive month. Though inflation is gradually slowing it remains well above the Fed’s preferred level of 2.0%. The personal consumption expenditures (PCE) price index gained 0.1% in March, the smallest increase since last July, after rising 0.3% in February. In the 12 months through March the PCE price index increased 4.2%. That was the smallest advance since May 2021 and followed a 5.1% rise in February. Excluding the volatile food and energy components, the PCE price index rose 0.3%, in March, matching February's gain. The core PCE price index was up 4.6% year over year, a slight decline from 4.7% year over year in February. The Fed tracks the PCE price indexes for its 2% inflation target. Consumer Confidence Falls to 101.3 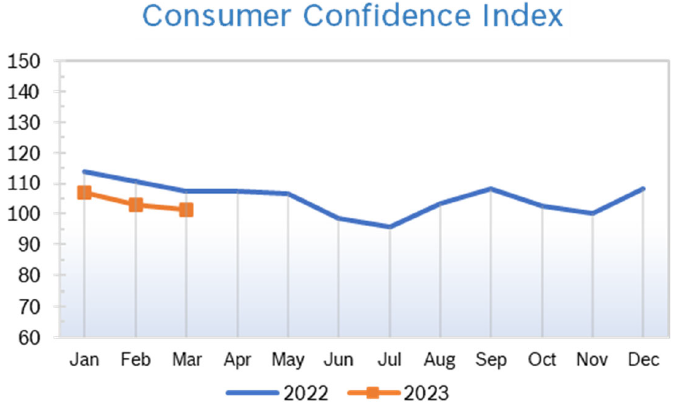
Unemployment Falls to 3.4% 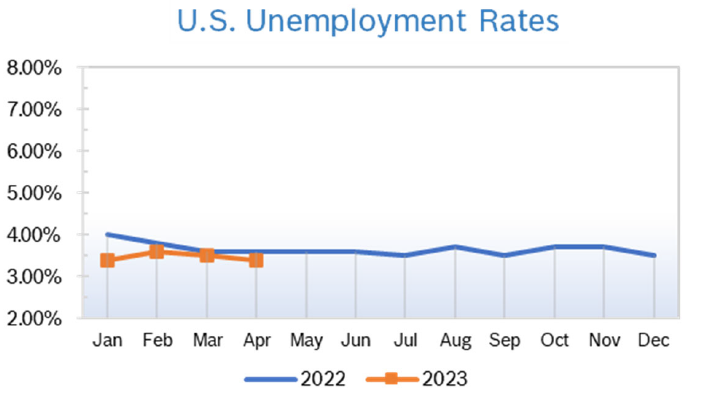 The unemployment rate fell to 3.4% in April after falling to 3.5% in March. Unemployment was 3.5% at the beginning of the pandemic in March 2020.
Chicago PMI Rises to 48.6 The Chicago PMI rose to 48.6 in April after inching up to 43.8 in March. The 4.8 point increase left the index still below 50, the level that signifies expansion, for the eighth consecutive month. Economists had expected another decline. A PMI number above 50 signifies expanded activity over the previous month; this was the sixth consecutive reading below 50, the level which indicates contraction. Looking back to when the series began in 1967, the PMI has ranged from 20.7 in June 1980 to 81.0 in November 1973. Wholesale Prices Fall 0.5% The Producer Price Index (PPI) fell 0.5% in March after slipping 0.1% in February and was up 2.7% year over year after being up 4.7% in February. It was the mildest year-over-year increase in more than a year. Stripping out volatile food and energy prices, core PPI fell 0.1% in March after rising 0.3% in February and was up 3.4% year over year, a sharp drop from 5.4% in January and February. The PPI peaked at a whopping 11.7% year-over-year increase in March 2022. Q1 GDP Grows 1.1% Q1 GDP grew an anemic 1.1% in the first reading from the Commerce Department, down from Q4 growth of 2.5%. Economists had expected GDP growth of around 2% for the first quarter. Declining business investments offset consumer spending that grew a robust 3.7%, the largest increase in two years. Households boosted spending on durable goods by a whopping 17%, much of which reflected a big jump in auto sales. Companies cut investments and reduced production, trimming 2.3% off GDP. Many economists believe that the combination of rising interest rates and stubbornly high inflation will result in a mild recession during the second half of the year. Inflation rose at an annual pace of 4.2% in the first quarter, compared to 3.7% in Q4 last year. © Robert Bosch Tool Corporation. All rights reserved, no copying or reproducing is permitted without prior written approval.
|
|