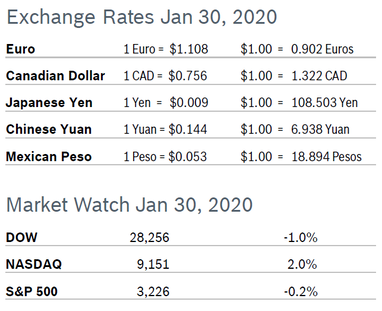
 After solid gains for most of the month, the major indexes all fell on the last day of January, as markets were rattled by the rapidly spreading deadly coronavirus. The DOW tumbled more than 600 points after China confirmed there have been nearly 11,000 cases, with the death toll rising to more than 250. the US declared the virus, which has now spread to more than 24 countries, a national health emergency, and major airlines suspended flights to China. The NASDAQ held on to a 2% gain, but the DOW dropped 1% and the S&P, the index most followed by analysts and economists, dropped 0.2%. Consumer Spending Rises 0.3% Consumer spending rose 0.3% in December after rising 0.4% in November, matching economists’ expectations. It was the ninth consecutive monthly increase for consumer spending. Core consumer spending rose 0.1% in December after rising 0.3% in November. Personal income rose 0.2% and wages rose 0.3% after each rising 0.4% in November. Income growth lagged consumer spending, which sent savings down from $1.30 trillion in November to $1.28 trillion in December. For all of 2019, consumer spending increased 4.0% after rising 5.2% in 2018 and income increased 4.5% after jumping 5.6% in 2018. Wells Fargo expects consumer spending to moderate but not decline in 2020. Consumer spending accounts for more than two-thirds of US economic activity. Consumer Confidence Rises to 131.6 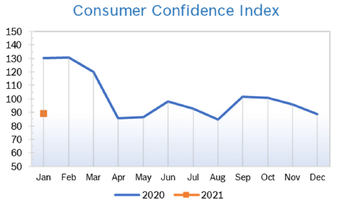
Consumer Prices Rise 0.2% The Consumer Price Index (CPI) rose 0.2% in December after rising 0.3% in November. The year-over-year CPI increase rose 2.3% in December after being up 2.1% in November. The year-over-year increase was the fastest pace in eight years, but inflation remains very low. Excluding the volatile food and energy categories, core prices rose 0.1% in December after increasing 0.2% for the previous two months. Core prices were up 2.3% from a year ago. Higher gasoline prices in December and a modest increase in food prices impacted overall inflation. Although the scheduled increase in tariffs was avoided in December, tariffs on roughly two-thirds of consumer goods imported from China remain in place, but are having little impact on inflation. For the full year of 2019, gas prices rose almost 8% and rents increased 3.7%. Americans paid less in 2019 for clothes, fruits, vegetables and consumer electronics, including computers and televisions, categories where prices have been falling for years. The cost of new vehicles has been essentially unchanged for two years. Unemployment Rises to 3.6% 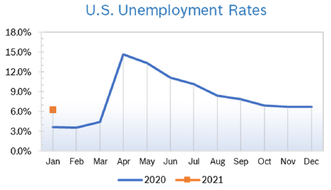
Job Openings Drop The number of job openings dropped to 6.80 million in November after rising to 7.27 million in October, according to the most recent Job Openings and Labor Turnover Survey (JOLTS) from the U.S. Bureau of Labor Statistics. The drop of 561,000 jobs was concentrated in the construction and retail sectors. It was the lowest reading since August 2015. Job openings reached a peak of 7.6 million in November 2018. The job openings rate decreased to 4.3% in November from 4.6% in October. Hiring increased to 5.82 million in November from 5.78 million in October, and the hiring rate was unchanged at 3.8%. Hires and separations were little changed at 5.8 million and 5.6 million, respectively. Within separations, the quits rate was unchanged at 2.3% and the layoffs and discharges rate was little changed at 1.1%. The quits rate is viewed by policymakers and economists as a measure of job market confidence. Chicago PMI Falls to 42.9 The Chicago Purchasing Managers Index (Chicago PMI), tumbled to 42.9 in January after rising to 48.9 in December. Analysts had expected a much smaller decline. All five major components declined in January. New Orders fell more than 6 points to 41.5. Production fell 3.8 points to 42.7. Order Backlogs fell to a four year low of 34.6. Prices paid fell 2.1 points to 56.1. January’s special question asked whether the signing of the US-Mexico-Canada trade agreement would improve their supplier lines. The majority (60%) expect no improvement at all; 40% expect little change. Looking ahead, half of respondents expect average growth for their business to be below 5%; 43.2% expect to see growth between 5% and 10%, and 6.8% project growth better than 10%. Wholesale Prices Rise 0.1% The Producer Price Index (PPI) rose 0.1% in December after being flat in November and was up 1.3% year over year, the smallest annual increase since 2015. Core producer prices, which exclude food and energy, were also flat in November after inching up 0.1% in October and rose just 1.1% year over year. Q4 GDP Grows 2.1% Q4 GDP grew 2.1%, according to the first estimate from the Commerce Department. It was the third consecutive quarter of GDP growth between 2% and 2.1%. Growth for the full year of 2019 was 2.3%, thanks to robust growth in the first quarter. The economy grew 2.9% in 2018 and more than 3% from mid-2017 through mid-2018 thanks to a big surge in capital investment. Analysts note that trade issues and tariffs were the biggest contributors to the low rate of growth. Exports contributed nothing to GDP growth in 2019. The Federal Reserve's favorite inflation indicator, the core personal consumption expenditures (PCE) price index, registered a 1.3% increase, slower than the 2.1% growth in the third quarter. Growth in the headline PCE price index picked up to 1.6% from 1.5% Full-year PCE growth weakened to 2.6% in 2019 from 3.0% in 2018. GDP Forecast 2020 GDP is expected to grow 1.9% this year, the slowest pace of economic expansion in several years, according to a recent Barron’s survey of market strategists. Consumers will remain the driving force of the economy thanks to low unemployment and wages that are generally growing faster than inflation. © Robert Bosch Tool Corporation. All rights reserved, no copying or reproducing is permitted without prior written approval.
|
|