|
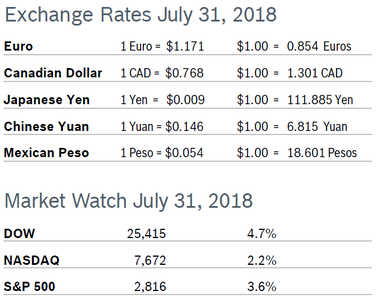
The major indexes all advanced in July, with the DOW posting the largest monthly gain since January, and the NASDAQ and S&P 500 turning in the fourth consecutive monthly gain. Markets were boosted by solid economic news, good corporate earnings and news that the US and China were exploring ways to cool off the impending trade war between the two countries. Consumer Confidence Rises to 127.4 The New York-based Conference Board’s Consumer Confidence Index rose to 127.4 in July after dropping to 127.1 in June. The Present Situation Index rose to 165.9 from its June reading of 161.1. The Expectations Index continued to drop, falling to 101.7 after falling to an upwardly revised 104.0 in June. Consumers’ views of the short-term outlook over the next six months dropped again, and the outlook for job prospects was mixed. Economists note that a level of 90 indicates that the economy is on solid footing and a level of 100 or more indicates growth. Analysts caution that the real driver behind consumer spending is income growth and that labor market trends are a more accurate predictor of consumer behavior. Consumer Spending Rises 0.4% Consumer spending rose 0.4% in June and data for May was revised up to 0.5% growth from the 0.2% first reported. The increase was in line with economists’ expectations. Spending was supported by a 0.4% increase in personal income. Savings edged up to $1.050 trillion from $1.047 trillion in May. The personal consumption expenditures (PCE) price index excluding food and energy rose 0.1% in June after rising 0.2% in May. That kept the annual increase in the core PCE price index at 1.9% for the third consecutive month. The core PCE index is the Fed’s preferred measure of inflation. The core PCE hit the Fed’s target of 2% inflation in March for the first time since December 2011 before falling back slightly. Consumer Prices Rise 0.1% The Consumer Price Index (CPI) rose 0.1% in June after rising 0.2% in both May and April. The CPI was up 2.9% over the past twelve months, the largest annual gain since February 2012. Core inflation, which excludes food and energy, rose 0.2% in June after rising 0.3% in May and was up 2.3% from June 2017. Gasoline prices rose 0.5% in June and have soared 24.3% over the past 12 months. Fuel oil has surged nearly 31% over the past year. Overall housing cost have increased 3.4%. Gasoline prices typically rise as the summer driving season gets underway. Unemployment Falls to 3.9% The unemployment rate fell to 3.9% in July after rising to 4.0% in June and the economy added 157,000 new jobs, below expectations of 193,000 jobs. However, job gains for June were revised up to 248,000 new jobs from the initial 213,000 reported and gains for May were revised up by an additional 24,000 jobs. Wage gains were in line with expectations, rising 0.3% in July and up 2.7% over the past year. Manufacturing was the most robust sector, adding 37,000 new jobs, many of them in durable goods manufacturing. Construction added 19,000 new jobs in July; construction has increased by 308,000 over the year. Employment in retail inched up, with the sector adding an additional 7,000 jobs. Durable Goods Orders Rise 1.0% Durable goods orders rose 1.0% in June after falling 0.6% in May. Although results were below expectations of a 3.8% increase, it was still the first rise in durable goods orders in three months. Excluding the very volatile transportation category, orders rose 0.4% in June after falling 0.3% in May. Nondefense capital goods orders excluding aircraft, widely regarded as a proxy for business spending plans, rose 0.6% after rising an upwardly revised 0.7% in May. Nondefense capital goods shipments, which factor into GDP, rose 1.0%, more than twice the rate expected. The durable goods report is volatile and often subject to sharp revisions. Chicago PMI Rises to 65.5 The Chicago Purchasing Managers’ Index (PMI) rose to 65.5 in July after rising to 64.1 in June and was up 10.1% year over year. It was the highest level for the index in the past six months. Four of the five components rose for the month, with New Orders and Production recording six-month highs, leaving them up 8.0% and 10.6% for the year, respectively. Somewhat offsetting the growth was a decline in Supplier Deliveries. Order Backlogs continue to grow, with the indicator hitting a nine-month high and lead times on key materials remaining elevated, creating longer wait times for finished goods. Price pressures continue to impact operations, with Prices Paid rising to its highest level since September 2008. Higher prices were widespread across a range of key inputs. More than half of the firms surveyed expect demand to pick up even more in the third quarter. Wholesale Prices Rise 0.3% The Producer Price Index (PPI) rose 0.3% in June after jumping 0.5% in May, continuing the upward climb in producer prices that has been going on since August 2016. The increase was greater than expected and primarily due to increases in the cost of services and motor vehicles. The PPI was up 3.4% from June 2017. Core producer prices, which exclude food, energy and trade services, rose 0.3% in June after rising by a downwardly revised 0.1% in May. The core PPI was up 2.7% from June 2017. There were increases in the costs of materials used in manufacturing and construction, including softwood lumber, iron and steel mill products as well as nonferrous metal products. Construction materials and components were up 10.4% on a 3-month annualized basis, the second-fastest pace since September 2008. Q2 GDP Rises 4.1% GDP grew a robust 4.1% in the second quarter and first quarter GDP was revised up to 2.2% from the previously reported 2.0% due to new source information and methodology. It was the fastest pace in nearly four years. Strong 4.0% growth consumer spending boosted results; consumer spending inched up just 0.5% in the first quarter. Spending on durable goods contributed 0.64% to growth. Many analysts believe that growth peaked in the second quarter, and overall growth for the year will come in between 2.5% and 3.0% as global growth moderates and the Fed continues to raise interest rates. In addition, the potential impact of new tariffs is yet to be seen. In fact, a rush by exporters of soybeans and other products scheduled for tariff increases to move product to other countries before tariffs take effect sent exports surging 9.3% after growing just 0.5% in the second quarter. Business investment grew at a solid 7.3% and government spending rose 2.1%. But housing, which has struggled all year, shrank at a 1.1% annual rate after dropping 3.4% in the first quarter. Job Openings Edge Down The number of job openings edged down to 6.6 million in May from an upwardly revised April level of 6.8 million, according to the Job Openings and Labor Turnover Survey (JOLTS). Over the month, hires and separations were little changed at 5.8 million and 5.5 million, respectively. Within separations, the quits rate and the layoffs and discharges rate were little changed at 2.4% and 1.1%, respectively. The number of job openings decreased in the private sector and were little changed in government. Hires have outpaced separations in every month since August 2010. The JOLTS report is one of the Fed’s preferred economic indicators. Fed Holds Rates Steady The Federal Reserve held interest rates steady in a range of 1.7% and 2.0% during their policy meeting at the end of July but indicated there was a high probability they would raise rates at the next meeting in September. The Fed noted that economic activity has been increasing “at a strong pace” and that the labor market continues to strengthen. Markets widely anticipate a total of two additional rate hikes of 0.25% each this calendar year. Impact of New Tariffs White House trade advisor Peter Navarro said that the current trade strategy with China is not as disruptive as it might appear. The two countries have a combined GDP of $30 trillion. The amount of trade that is being affected by new tariffs is about 4% of total trade between the two countries, so a very small percentage of both GDP and overall trade. © Robert Bosch Tool Corporation. All rights reserved, no copying or reproducing is permitted without prior written approval.
|
|


