 Stocks traded in a narrow range the end of the month and all three indexes closed out the first half of the year with double-digit gains. For the month of June, solid economic data tempered concerns about inflated valuations and a more contagious variant of CV19. Consumer Spending Unchanged Consumer spending was unchanged in May after increasing an upwardly revised 0.9% in April. Core consumer spending fell 0.4% in May after rising an upwardly revised 0.3% in April. Personal incomes fell 2.0% in May after tumbling 13.1% in April. However, wages grew 0.8% after rising 1.0% in April. Growing demand for and spending on services is being offset by a slowdown in real retail sales. Going forward, analysts expect consumer spending growth to remain strong as the services sector continues to normalize. Consumer Prices Rise 0.6% The Consumer Price Index (CPI) rose 0.6% in May after rising 0.8% in April and were up 5.0% year over year. It was the biggest year-over-year jump in inflation since 2008, and far exceeded analysts’ estimates. Core inflation, which excludes the volatile food and energy categories, rose 0.7% in May after jumping 0.9% in April and were up 3.8% from May 2020. Consumers are seeing higher prices in many categories, particularly in big-ticket items such as vehicles. Airfare and other prices that were depressed during the pandemic are also up disproportionately. The personal consumption expenditures (PCE) price index excluding the volatile food and energy component rose 0.5% in May after jumping 0.7% in April and was up 3.1% year over year, the largest gain since April 1992. The core PCE price index is the Fed's preferred inflation measure for its 2% target, which is now a flexible average. The Fed remains convinced inflation is transitory and is more focused on the employment situation. Consumer Confidence Rises to 127.3 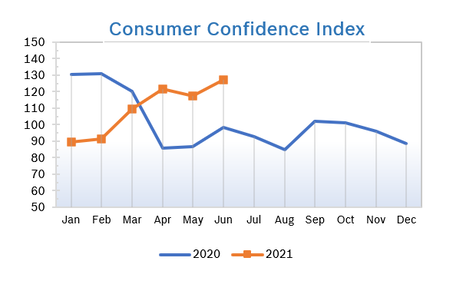
Unemployment Rises to 5.9% 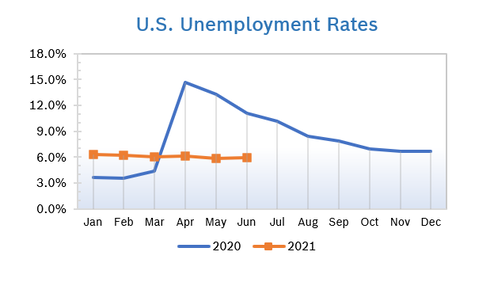
Job Openings Jump to Record High US job openings jumped by nearly one million jobs to a new record high of 9.3 million in April after setting a record in March, according to the latest Job Openings and Labor Turnover Survey (JOLTS) from the US Bureau of Labor Statistics (BLS). It was the highest number of job openings on record and up substantially from the pandemic low of under 5 million jobs. Hiring was little changed at 6.1 million from 6.0 million in April. Quits rose to a record-high 4 million in April from 3.6 million in May and layoffs and discharges fell by 81,000 to 1.4 million. The quits rate is normally viewed by policymakers and economists as a measure of job market confidence. However, the pandemic has forced millions of women to drop out of the labor force, primarily because of problems related to childcare; the labor force participation rate among women has dropped to levels not seen since the 1970s. There were just 1.1 workers per job opening in April, down from 1.2 per job opening in March but up from just 0.8 people pre-pandemic. JOLTS is a lagging indicator but is closely watched by the Federal Reserve and factors into decisions about interest rates and other measures. Chicago PMI Falls to 66.1 The Chicago Purchasing Managers Index (Chicago PMI) fell to 66.1 in June after rising to a nearly 50-year high of 75.2 in May. Despite the decline, it was the 12th consecutive month the index remained in positive territory. New Orders dropped to a three-month low and all the other main indicators also fell, with the exception of Supplier Deliveries, which improved. Prices Paid surged to the highest level since 1979 after falling in May. Companies noted that prices were rising due to materials shortages, and 82% said that rising prices will have a material effect on their business decisions. Looking back to when the series began in 1967, the PMI has ranged from 20.7 in June 1980 to 81.0 in November 1973. Wholesale Prices Rise 0.8% The Producer Price Index rose 0.8% in May after rising 0.6% in April. The increase was above expectations and marked the fifth consecutive monthly increase in wholesale prices. Prices were up 6.6% from May 2020 after being up 6.2% year over year in April. Core inflation, which excludes the volatile food and energy categories, rose 0.7% for the third consecutive month and was up 5.3% year over year, the largest year-over-year gain since reporting began in 2014. Prices were driven up by substantial increases in wholesale food prices and energy, both of which are stripped out of core prices. Nearly 60% of the wholesale price increase from May reflected a 1.5% increase in prices for goods; prices for services rose 0.6%. Analysts noted that year-over-year inflation numbers will be higher going forward because of the year-over-year comparison to very low numbers caused by the pandemic as well as near-term pressures from supply chain bottlenecks. Q1 GDP Grows 6.4% GDP grew an unrevised 6.4% in the first quarter as stimulus checks went out, vaccinations accelerated, states lifted restrictions and consumers stepped up spending, according to the third and final reading from the Commerce Department. The increase in real GDP in the first quarter reflected increases in personal consumption expenditures, nonresidential fixed investment, federal government spending, residential fixed investment and state and local government spending that were partly offset by decreases in private inventory investment and exports. The increase in first quarter GDP reflected the continued economic recovery, reopening of establishments and continued government response related to the pandemic. Economists expect growth to pick up further in the second quarter and remain steady in the second half of the year. Many forecasts call for GDP to grow between 6% and 7% this year, which would be the strongest performance since a 7.2% gain in 1984 when the economy was emerging from a deep recession. The Fed’s GDP forecast for this year was revised to growth between 6.5% to 7.0% in mid-June. Fed Holds Rates for Now The Fed maintained their target fed funds rate range of between zero and 0.25% at their meeting in mid-June, and reassured investors they will continue to support the economy via asset purchases while the US continues to recover from the pandemic. However, the Fed’s latest “dot plot” economic forecast shows that 11 Fed members see no change to interest rates through at least 2022, five forecast rates will rise by 0.25% by the end of 2022 and two members forecast a 0.5% increase. All but five members now forecast at least one rate hike by the end of 2023. Analysts noted that an adjustment to rock-bottom interest rates is the next step needed for full economic recovery, and urged investors not to panic, but rather to greet the news as a natural step towards a healthy, functioning economy. Treasury Secretary Janet Yellen, a former Chairman of the Fed, said the US has been dealing with inflation and interest rates that are both currently too low for a healthy economy, and we need to get back to a more normal interest rate environment, not too hot and not too cold. © Robert Bosch Tool Corporation. All rights reserved, no copying or reproducing is permitted without prior written approval.
|
|