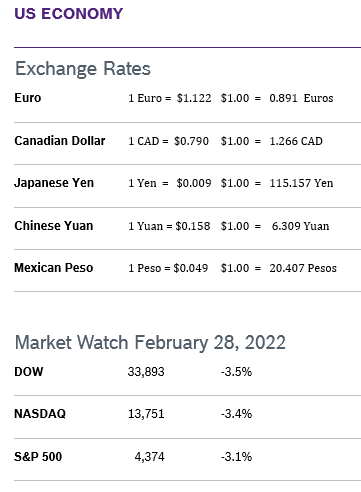
 Markets ended the month down but proved more resilient than first expected just a few days after the Russian invasion of Ukraine outraged the world. Gold and oil jumped, the ruble plunged and Russia found itself increasingly cut off from the world’s financial systems. Markets hate uncertainty, and speculation about Putin’s state of mind and likely courses of action did little to quell the unease. However, analysts also speculated that the current crisis may cause the Fed to pause its plan to raise interest rates. Heavy volume, big swings and uncertainty about what lies ahead all contributed to exceptional volatility. Consumer Spending Rises 2.1% Consumer spending rose a solid 2.1% in January after falling downwardly revised 0.8% in December. Spending exceeded expectations but price pressures continue to mount. Core consumer spending rose 1.5% after declining a downwardly revised 1.9% in December. Personal incomes were unchanged as a 0.5% increase in wages was offset by a decrease in government social benefits. The report suggested strong underlying strength in the economy that could help it keep expanding when the Fed begins raising rates and provide some shield from the fallout from Russia’s invasion of Ukraine. Consumer Prices Rise 0.6% The Consumer Price Index (CPI) rose 0.6% in January after rising 0.5% in December and was up 7.5% year over year. It was the largest year-over-year increase in thirty years for the second consecutive month. Core inflation, which excludes the volatile food and energy categories, rose 0.6% in January after rising 0.6% in December and was up 7.0% year over year, the biggest increase since 1982. Prices increased across most categories. The core PCE, which omits volatile food and energy costs, rose 0.5% in January after rising 0.5% in December. The core rate rose 4.9% in 2021, compared to a mild 1.5% gain in the prior year. That’s the highest annual level since 1982.The core PCE price index is the Fed's preferred measure for its 2% inflation target, which is now a flexible average. Consumer Confidence Falls to 110.5 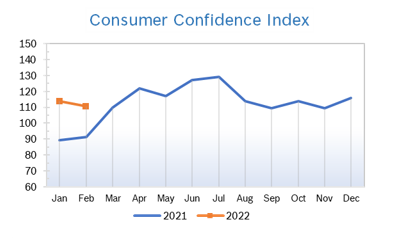
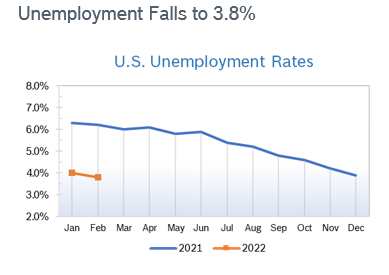
Job Openings Rise Job openings reached 10.9 million in December, up from 10.8 million in November and near their all-time high, according to the most recent Job Openings and Labor Turnover Survey (JOLTS). Openings have topped 10 million for seven straight months. The rise in openings was driven by a big increase in openings in restaurants and hotels, both industries hit hardest by CV19-induced shutdowns and that have struggled the most to bring on workers. The number of employees quitting jobs fell to 4.3 million from a record 4.5 million in November. That means 2.9% of workers voluntarily left their positions, typically to take new, better-paying jobs. Since there were 6.3 million unemployed Americans in December, the 10.9 million openings translate to 1.7 available jobs for each unemployed person, the most on records dating back two decades. The number of total hires fell from 6.6 million to 6.3 million amid the COVID-19 surge. Chicago PMI Falls to 56.3 The Chicago Purchasing Managers Index (Chicago PMI) fell to 56.3 in February after rising to 65.2 in January. Although it was the 20th consecutive month the index remained in positive territory results were well below expectations. All five of the main indicators fell, with New Orders dropping to a 20-month low. A PMI number above 50 signifies expanded activity over the previous month. While remaining in positive territory, the index has been on a downward trend since last May, when scarcity of supply amid booming demand began having an impact. Looking back to when the series began in 1967, the PMI has ranged from 20.7 in June 1980 to 81.0 in November 1973. Wholesale Prices Rise 1.0% The Producer Price Index rose 1.0% in January after rising just 0.2% in December and was up 9.7% year over year, the highest increase since the federal government started tracking this data in 2010 for the second consecutive month. Core inflation, which excludes the volatile food and energy categories, rose 0.85 in January after rising 0.5% in December and was up 8.3% from January 2021. The jump in wholesale prices significantly exceeded expectations and since it also exceeds the rate of inflation, the increase in wholesale prices will eventually push consumer prices up even higher. Q4 GDP Grows 7.0% Economic growth was revised up to 7.0% from 6.9% in the fourth quarter, according to the second reading from the Commerce Department. The revision met economists’ expectations. The biggest change was an increase in business investment, especially housing. Residential spending rose 1% instead of declining 8% as initially reported. Spending on equipment was revised up to 3.1% from 2%. Most other categories were little changed. Most economists still project that GDP will grow a healthy 3% to 4% this year despite inflation and uncertainty. © Robert Bosch Tool Corporation. All rights reserved, no copying or reproducing is permitted without prior written approval.
|
|