|
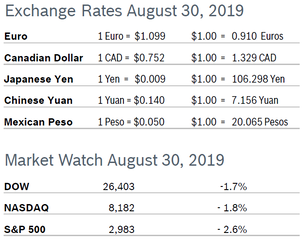
The markets all finished in the red for August, turning in their worst monthly results since May. Conflicting economic news, an escalating and volatile trade situation and worries about the future direction of the economy all contributed to the decline. Consumer Confidence Falls to 135.1 The New York-based Conference Board’s Consumer Confidence Index fell marginally to 135.1 in August after rising to 135.7 in July, according to the Conference Board’s latest survey. The decline was less than economists expected after a month of economic and market turbulence. The Present Situation Index, which is based on consumers’ assessment of current business and labor market conditions, rose to 177.2 after rising to 170.9 in July and is now at its highest level in nearly 19 years. The Expectations Index, which is based on consumers’ short-term outlook for income, dropped to 107.0 after rising to 112.2 in July. Wells Fargo noted that the survey is taken mid-month and that the drop in the Expectations Index is a sign people are growing more nervous about the future. Economists note that a level of 90 indicates that the economy is on solid footing and a level of 100 or more indicates growth. Analysts caution that the real driver behind consumer spending is income growth and that labor market trends are a more accurate predictor of consumer behavior. Consumer Spending Jumps 0.6% Consumer spending jumped 0.6% in July after rising 0.3% in June. Core consumer spending rose 0.4% in July after rising 0.2% in each of the previous three months. Personal income rose 0.1% after increasing an upwardly revised 0.5% in June. Savings fell to $1.27 trillion, the lowest level since November 2018. Inflation pressures remained low, with the personal consumption expenditures (PCE) price index excluding the volatile food and energy components rising 0.2% for the fourth consecutive month. In the 12 months through June, the core PCE price index increased 0.6%, well below the Fed’s preferred inflation reading of 2.0%. Consumer Prices Rise 0.3% The Consumer Price Index (CPI) rose a seasonally adjusted 0.3% in July after rising 0.1% in June. The year-over-year CPI was up 1.8% in July after being up 1.6% in June. Excluding the volatile food and energy categories, core prices were up 0.3% in July and 2.2% from a year ago, the biggest increase in six months. Gains were modest, but widespread. Unemployment Remains at 3.7% The unemployment rate remained at 3.7% in August and the economy added 134,000 new jobs, well below expectations of 160,000 jobs. Unemployment is at the lowest level since 1969. Job growth for June and July was revised down by a total of 20,000 jobs. The pace of job creation this year has slowed, with the economy adding an average of 158,000 jobs each month, down from 223,000 last year. Employment in construction, manufacturing, warehousing and transportation was steady. The private sector added 96,000 jobs. Wage growth rose 0.4% (11 cents per hour) and was up 3.2% year over year. Unemployment remained at 3.7% because the labor participation rate edged up again. The economy needs to create about 120,000 new jobs each month to keep up with growth in the working-age population. Durable Goods Orders Rise 2.1% Durable goods orders rose 2.1% in July after rising 2.0% in June. However, excluding a 47.8% surge in aircraft and parts due primarily to Boeing orders, durable goods orders fell 0.4%. Core durable goods orders for non-defense capital goods excluding aircraft, widely regarded as a key indicator of business spending, rose 0.4% in July but orders for June were revised down, leaving the overall level for core goods down. Nondefense capital goods shipments, which factor into GDP, fell 3.0% in July and June shipments were revised down to a 0.9% gain. The durable goods report is very volatile and often subject to sharp revisions. Chicago PMI Rises to 50.4 The Chicago Purchasing Managers’ Index (PMI) rose to 50.4 in August after falling to 44.4 in July, reversing two consecutive months of below-50 readings. Supplier Deliveries fell sharply to 50.3 from 55.6 in July. Production picked up 6.7 points but remains muted and New Orders saw the largest single component monthly gain and shifted back into expansion. Prices Paid rose 3.7 points, reaching a five-month high of 59.8. August’s special question concerned business investment plans for the remainder of the year. The majority of respondents, 63%, envision no change in their plans, 27% plan to increase their investments and 10% intend to reduce them. Economists use the Chicago PMI and other regional indicators to gauge the health of the ISM manufacturing index. Wholesale Prices Rise 0.2% The Producer Price Index (PPI) rose 0.2% in July after inching up 0.1% in June and was up 1.7% year over year. Core producer prices, which exclude food, energy and trade services, fell 0.1% after being flat in June and were up just 1.7% year over year. The increase was primarily driven by an increase in gasoline prices in July during the height of the summer driving season; prices for services declined 0.1% after five months of increases. Q2 GDP Growth Revised Down to 2.0% GDP growth was revised down to 2.0% for the second quarter from the first quarter’s surprisingly strong growth of 3.1% but was still ahead of expectations for 1.8% growth, according to the second reading from the Commerce Department. Consumer spending was revised sharply upwards to 4.7%. The increase in consumer spending almost offset small downward revisions in other areas. Business fixed investments and net exports were both revised lower, partially reflecting the ongoing trade war with China. Corporate profits rose a solid 2.7% year over year after dipping in the first quarter, but business investment declined at an unrevised 0.6% rate, the first contraction since the beginning of 2016. The second release shows how the income side of the economy is doing. Real domestic income (GDI) was up 2.1%. Job Openings Flat The number of job openings was largely unchanged at 7.35 million in June after dropping to 7.30 million in May, according to the most recent Job Openings and Labor Turnover Survey (JOLTS). Total hiring fell 1.0% to 5.7 million, below the record of nearly 6 million set in April. There are currently nearly 1.3 available jobs for every unemployed person, and figures indicate that businesses remain in a hiring mode, a sign they are confident that the economy will keep growing. The quits rate was also little changed in June, with roughly 2.3% of workers quitting their jobs, a figure that has been relatively stable for the past year. The quits rate is viewed by policymakers and economists as a measure of job market confidence. The Impact of Tariffs Some tariffs due to be imposed September 1 will be delayed until December 15, reportedly so that they will not impact the holiday shopping season. Most of the tariffs being delayed are on consumer goods like laptops, cellphones and toys. However, additional 15% tariffs were imposed on a long list of about $112 billion in Chinese imports. The previous round of tariffs primarily impacted industrial goods, but under the new tariff schedule 69% of the consumer goods will face higher tariffs compared to 29% previously. If the tariffs delayed until December 15 are applied, the average tariff on Chinese imports will have risen from 3.1% in 2017 to 24.3%. US companies say they will be forced to pass at least some of the costs on to consumers, who will be forced to choose between paying higher prices, trading down or putting off any discretionary purchases. Financial analysts were quick to point out that the imposition of the tariffs could have a wide-ranging impact on the economy. Goldman Sachs lowered their forecast for US economic growth, and also predicted that the trade war between China and the US will not be resolved before the 2020 election. Moody’s Analytics said that if the tariff issue can be resolved, the economic expansion could continue through the end of 2020 or beyond; if it is not resolved, it could send the economy into recession. Businesses are growing wary and losing confidence that the issues can be resolved before they have a big negative impact on the economy. NABE Recession Forecast A strong majority, 74%, of NABE economists expect a recession in the US by the end of 2021. Just 2% expect a recession to begin this year while 38% predict that a recession will occur sometime next year. The latest survey was taken during the last two weeks of July before the yield curve on the 10-year Treasury Bond briefly fell below the yield on short term Treasuries, an inversion that has correctly signaled many of the past recessions because it’s an indicator that people are less confident about the future than they are about the present. However, it is a long indicator; typically, the recession, if it occurs, will be at least a year away. The lack of resolution to the trade war with China and a faltering global economy has added additional pressure. © Robert Bosch Tool Corporation. All rights reserved, no copying or reproducing is permitted without prior written approval.to edit.
|
|


