 The markets regained a lot of lost ground during April, with the S&P, the index most watched by professionals, up more than 30% from its bottom March 23. All three indexes posted their best months in decades on optimism that lockdowns will ease and the belief that the fiscal and monetary stimulus will put a floor on the recession and aid a fast recovery. The market is building in a second-half recovery that will begin after a dismal second quarter, but analysts warn that the markets may have gotten ahead of themselves, and another decline could lie ahead before a true recovery begins. Wild cards remain, including finding a vaccine and an effective treatment and avoiding a second round of serious infections as the country begins to relax restrictions. On average, it takes markets about 24 months to fully recover from a major downturn; this is impacted by many factors, including what precipitated the losses and the shape and nature of the recovery. Consumer Spending Falls 7.5% Consumer spending fell a record 7.5% in March after rising 0.2% in February, ending eleven consecutive monthly gains. Core consumer spending fell 7.3% after rising 0.1% in February. Personal income tumbled 2.0% in March, the biggest drop since January 2013. One of the reasons for the big slump was a large drop in outlays on healthcare as dental offices closed and hospitals postponed elective surgeries and non-emergency visits. Consumer spending accounts for 70% of US economic activity. Consumer Confidence Falls to 86.9 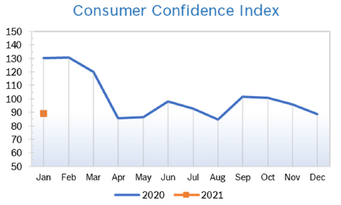
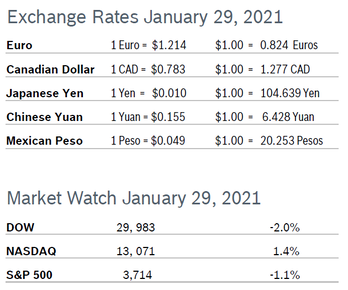
Consumer Prices Fall 0.4% The Consumer Price Index (CPI) fell 0.4% in March, the fastest pace in more than five years. The CPI was pushed lower by a sharp decline in energy prices resulting from the oil war raging between Russia and Saudi Arabia and low demand. The CPI rose 2.3% year over year in February after rising 2.5% in January. Analysts say that consumer prices may decline in the months ahead as the CV19 outbreak depresses demand for some goods and services, outweighing price increases related to shortages caused by disruptions to the supply chain. Excluding the volatile food and energy categories, core prices fell 0.1% in March after rising 0.2% in both January and February. Monthly inflation was subdued in March, with the core personal consumption expenditures (PCE) price index dropping 0.1%, the weakest reading since March 2017. The core PCE was up 1.7% year over year. Core PCE index is the Fed’s preferred measure of inflation and has consistently undershot the central bank’s target of 2.0%. Unemployment Rises to 14.7% 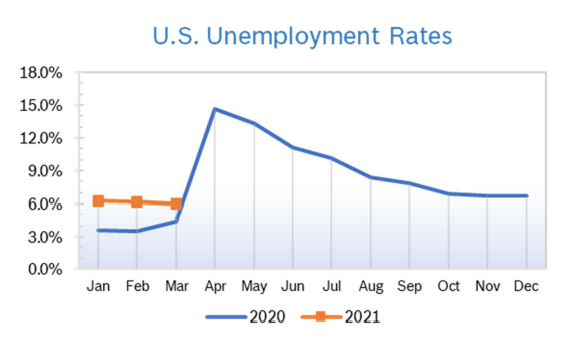
Job Openings Edge Down in February The number of job openings dropped by 130,000 to 6.9 million in February after rising to an upwardly revised 7.5 million in January, according to the most recent Job Openings and Labor Turnover Survey (JOLTS) from the US Bureau of Labor Statistics. The survey was completed before CV19 began to seriously impact employment. The quits rate held at 2.3% for the sixth consecutive month and the number of worker voluntarily quitting their jobs fell to 3.5 million in February from 3.6 million in January. Layoffs rose to 1.8 million in February from 1.7 million in January. The decline in job openings was led by real estate and rental and leasing, as well as leisure and hospitality. Retailers had more than 700,000 job openings in February. Hiring was little changed at 5.9 million. The CV19 outbreak has subsequently thrown tens of millions of people out of work. Moody’s noted that there is no way yet to know how much hiring has been frozen in industries that are still operating because people are able to work from home. Chicago PMI Falls to 35.4 The Chicago Purchasing Managers Index (Chicago PMI) fell to 35.4 in April after dropping to 47.8 in March. It was the tenth consecutive sub-50 reading for the index and the lowest reading since March 2009. Among the five indicators, Production and New Orders posted the steepest declines. Production dropped by 19 points to the lowest level since June 1980 and the drop in New Orders was record-setting. Inventories rose substantially but remain below 50 and the demand for labor dropped. Prices Paid slipped below 50, dropping to the lowest level since March 2016. A majority of responders reported that they had not taken any action to alleviate the supply crisis due to CV19, while 43.1% reported they had implemented major changes. The survey ran from April 1 to April 20. The index hit a high of 67.3 in October 2017. Looking all the way back to when the series began in 1967, the range has been from 20.7 in June 1980 to 81.0 in November 1973. Wholesale Prices Fall 0.2% The Producer Price Index (PPI) fell 0.2% in March after dropping 0.6% in February. In the 12 months through March the PPI was up 0.7% after being up 1.3% year over year in February. Much of the decline was due to the third consecutive monthly decline in gasoline prices. Core producer prices, which exclude food, energy and retail trade margins, also dropped 0.2% in March after falling 0.1% in February. Core prices were up 1.0% year over year after being up 1.4% in February. The pricing date for the survey was March 10, just prior to states enforcing social-distancing orders and widespread Stay Home orders. Q1 GDP Falls 4.8% As expected, CV19 brought the decade-long U.S. economic expansion to an end. Q1 GDP fell 4.8%, according to the first reading from the Commerce Department, a mere foreshadowing of the drop in GDP expected for the second quarter. There were broad-based declines across most spending categories. Real personal consumption expenditures (PCE) dropped 7.6% in the first quarter, the steepest rate of decline in forty years. The big jump in non-durable goods spending reflects the late-March surge in spending at grocery stores. Spending on services usually grows even during a recession, but it slumped more than 10%, most likely because travel ground to a halt, sporting arenas and restaurants closed and non-essential medical and dental procedures stopped. The last time spending on services took a big dive was back in the fourth quarter of 1953, when it fell 3.0%. Non-residential fixed investment spending plunged 8.6% as business spending on equipment tumbled. Residential investment spending jumped 21%, most likely reflecting strength in the housing market in the first two months of the year. Much of the lockdown of the economy did not really start to take effect until the last two weeks of the quarter. Wells Fargo looks for real GDP to contract at a record-breaking pace in excess of 20% during the second quarter; other analysts predict an even steeper decline. Second Paycheck Protection Program A $484 billion relief package sailed through Congress and was signed into law in late April. Most of the funds will be available through the Paycheck Protection Program (PPP), designed to provide additional funding for America’s 30 million small businesses. The initial PPP, which was passed in late March as part of the CARES act, quickly reached its lending limit after approving nearly 1.7 million loans, which fell far short of helping all the small businesses in need. This round of funding contains provisions that close loopholes that allowed big chains and other well-capitalized businesses to apply in the last round. The bill also contains funding for hospitals. Analysts say further types of relief will be coming in the weeks and months ahead, including ways to give more relief to individuals, extend jobless benefits into the fall and help those who are laid off afford health insurance. © Robert Bosch Tool Corporation. All rights reserved, no copying or reproducing is permitted without prior written approval.
|
|