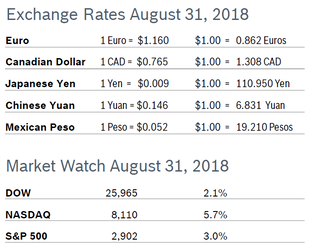
 The major indexes all advanced in August, typically a tough month for the markets, with the DOW and S&P posting the best August since 2014, and the NASDAQ turning in its best performance in August since 2000. It was also the fifth consecutive monthly gain for the NASDAQ and the S&P 500. Markets were boosted by good corporate earnings and news of a trade deal with Mexico that raised hopes that Canada would also reach an agreement with the US. Consumer Confidence Rises to 133.4 The New York-based Conference Board’s Consumer Confidence Index rose to 133.4 in August after rising to 127.9 in July, according to the Conference Board’s latest survey. It was the highest level of confidence since October 2000. Consumers’ assessment of the current situation continued to improve, and expectations for the future bounced back after declining in June and July. The Present Situation Index rose 6 points to 172.2 and the Expectations Index increased five+ points to 107.6. Only 12.7% of consumers claim jobs are “hard to get” and only 9.1% think business conditions are bad. High levels of confidence should continue to support healthy levels of consumer spending. Economists note that a level of 90 indicates that the economy is on solid footing and a level of 100 or more indicates growth. Analysts caution that the real driver behind consumer spending is income growth and that labor market trends are a more accurate predictor of consumer behavior. Consumer Spending Rises 0.4% Consumer spending rose 0.4% in July after rising by the same percentage in June. The increase was in line with economists’ expectations. Spending on goods rose 0.2% in July after slipping 0.1% in June. Spending on services rose 0.4% after surging 0.6% in June. Personal income rose 0.3% after growing 0.4% in June. Wages rose 0.4%. Spending is being supported by a robust labor market and an economy at what is regarded as full employment. Savings were little changed at $1.05 trillion. Inflation is cutting into wage gains, as disposable income adjusted for inflation rose 0.2% after increasing 0.3% in June. The personal consumption expenditures (PCE) price index excluding food and energy rose 0.2% in July after increasing 0.1% in June. That increased the core PCE price index to 2.0% from 1.9% in June. The core PCE index, the Fed’s preferred inflation measure, hit the Fed’s 2% inflation target for the third time this year in July after missing it since 2012. Consumer Prices Rises 0.2% The Consumer Price Index (CPI) rose 0.2% in July after rising 0.1% in June. The CPI was up 2.9% over the past twelve months for the second consecutive month. Core inflation, which excludes food and energy, rose 0.2% in July after rising 0.2% in June and was up 2.4% from July 2017. Much of the increase was driven by rising rents; the shelter index rose 0.3% in July, accounting for about 60% of the overall gain. The steady increase in inflation is cutting into household spending power, as real or inflation-adjusted hourly wages were flat in July and were down 0.2% from July 2017. Unemployment Steady at 3.9% The unemployment rate remained at 3.9% in August and the economy added 201,000 new jobs. Job gains for June and July were revised down by a total of 50,000 new jobs. The average monthly gain for the past 12 months is 196,000 new jobs; the economy needs to create about 120,000 new jobs each month to keep up growth in the working-age population. Job gains were spread across all sectors except manufacturing, where employment fell. Employment in construction continued to trend up in August with the sector adding 23,000 new jobs and has increased by 297,000 over the year. Average hourly earnings increased 0.4%, or 10 cents in August after rising 0.3% in July. That raised the annual increase in wages to 2.9% in August, the largest increase since June 2009. Durable Goods Orders Fall 1.7% Durable goods orders fell 1.7% in July after rising a downwardly revised 0.7% in June. It was the third decline in the past four months. The bigger-than-expected decline was due in part to a sharp drop in orders for transportation equipment, which fell 5.3% after jumping 1.8% in June. Core durable goods orders for non-defense capital goods excluding aircraft, regarded as a key indicator of business spending, jumped 1.4% in July after climbing 0.6% in June. Nondefense capital goods shipments, which factor into GDP, fell 0.2% in July after climbing 1.6% in June. The durable goods report is volatile and often subject to sharp revisions. Chicago PMI Falls to 63.6 The Chicago Purchasing Managers’ Index (PMI) fell to 63.6 in August after rising to 65.5 in July, which had been the highest level for the index in the past six months. The decline came after four consecutive months of gains. A softening in Supplier Deliveries, Order Backlogs and Employment offset gains in Production and New Orders. The PMI is still 6.9% higher compared to August 2017. The New Orders indicator is up 6.4% on the year and Production is up 9.1%. Supplier Deliveries fell for the second consecutive month but remained above 60, where it has stood for 11 out of the past 12 months. The Prices Paid indicator eased a bit in August but remained above 80 for the second time since late 2008. Firms continued to report elevated prices across a wide range of materials, from steel to resin, with many citing allocation issues stemming from ongoing trade disputes as a key reason. There were two special questions asked of panelists this month. The first asked whether they had passed higher input costs on to consumers, with more than 60% saying yes. Of those who said no, many said they faced intense competition, but may be forced to implement hikes in the coming months. The second question asked firms for their assessment of their current level of stock. One fifth thought their inventory was too high or too low, while about three-fifths of respondents thought it was just right. Wholesale Prices Flat The Producer Price Index (PPI) was unchanged in July after rising 0.3% in June. The PPI was up 3.3% from July 2017. Core producer prices, which exclude food, energy and trade services, rose 0.3% in July after rising by the same percentage in June. The core PPI was up 2.8% from June 2017, inching close to the record high of 2.9% reached in March. Both the headline and core indexes were depressed by an 0.8% drop in the very volatile “trade services” component, which measures profit margins for retailers and wholesalers. Analysts note this is a correction after a string of big increases, not a downward trend for the PPI. Q2 GDP Revised Up to 4.2% GDP growth was revised up to 4.2% in the second quarter from 4.1% in the first reading. Growth remained the fastest pace in nearly four years. Growth for the first half of 2018 was revised up to 3.2% from the 3.1% initially reported, putting the economy on track to grow 3.0% this year. Economists were surprised; they had expected GDP growth to be revised down to 4.0%. Businesses spent more on software than previously estimated and the nation also imported less petroleum. Stronger business spending and a drop in imports offset a small downward revision to consumer spending, which grew 3.8% in the quarter instead of the 4.0% first reported. Consumer spending has remained strong in the current third quarter, but the housing market has continued to weaken. Job Openings Rise The number of job openings increased by 3,000 in June to 6.66 million from a slightly downwardly revised number in May, according to the Job Openings and Labor Turnover Survey (JOLTS). The job openings rate was unchanged at 4.3%; there are currently more jobs available than people looking for a job (6.56 million). Hiring slipped by 96,000 to 5.7 million and the hiring rate fell to 3.8% from 3.9% in May. The quits rate held steady at a 13-year high of 2.3% for the fourth consecutive month, although the number of Americans voluntarily quitting their jobs fell by 78,000 to 3.4 million. Hourly earnings increased 2.7% on an annual basis in July and the layoffs rate rose slightly to 1.2% or about 1.7 million people. Hires have outpaced separations in every month since August 2010. The JOLTS report is one of the Fed’s preferred economic indicators. Fed May Raise Rates in September The Federal Reserve held interest rates steady in a range of 1.75% to 2.0% during their policy meeting at the end of July but indicated there was a high probability they would raise rates at the next meeting in September. The Fed noted that economic activity has been increasing “at a strong pace” and that the labor market continues to strengthen. Markets widely anticipate a total of two additional rate hikes of 0.25% each this calendar year. Core PCE inflation has been at or very close to the Fed’s target of 2.0%. © Robert Bosch Tool Corporation. All rights reserved, no copying or reproducing is permitted without prior written approval.
|
|