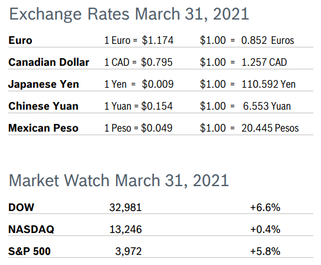
 Volatility returned to the markets in October as investors ignored strong quarterly results and focused on the lack of stimulus and further fiscal aid for businesses, the uncertain economic and political outlook and a surge of CV19 cases throughout the US and Europe. The DOW notched its worst monthly performance since March. Consumer Spending Rises 1.4% Consumer spending rose 1.4% in September after rising 1.0% in August and 1.9% in July. The increase in spending was more than expected. Consumers spent more on new motor vehicles, clothing, and whatever entertainment was available, including museums, sports centers, parks and theaters. In general, spending has shifted towards goods; since the economy is services driven, economists consider this an indication the recovery from the recession may take longer than anticipated. The savings rate slipped to a still-high 14.3% in September after peaking at a record 33.6% in April. Consumer spending accounts for 70% of US economic activity. Consumer Prices Rise 0.2% The Consumer Price Index (CPI) rose 0.2% in September after rising 0.4% in August and was up 1.4% year over year after being up 1.3% in August. Excluding the volatile food and energy components, core prices rose 0.2% after climbing 0.3% in August. In the 12 months through September, the core PCE price index rose 1.4% after advancing 1.4% in August. Consumer Confidence Falls to 100.9 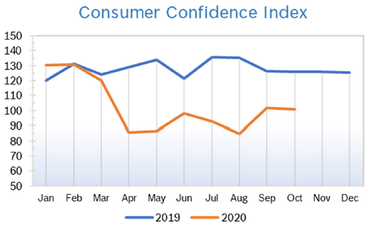
Unemployment Falls to 6.9% 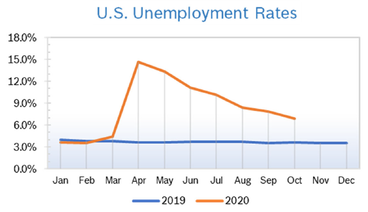
Job Openings Drop in August U.S. job openings declined in August for the first time in four months led by fewer openings in the construction and retail sectors, and fewer workers quit their jobs. Job openings, a measure of labor demand, fell by 204,000 to 6.49 million on the last day of August, according to the latest Job Openings and Labor Turnover Survey (JOLTS) from the US Bureau of Labor Statistics (BLS). Vacancies remain below their level of 7 million in February. The job openings rate fell to 4.4% from 4.6% in July. The number of people voluntarily quitting their jobs fell by 139,000 to 2.79 million. The number of hires, which includes rehired employees, improved slightly to 5.92 million, keeping the hires rate at 4.2%. Federal government hiring jumped almost 250,000 during the month, largely because of efforts to conduct the 2020 census. Separations, which include layoffs and quits, dipped to 4.59 million in August, reflecting decreases in the number of job cuts as well as people voluntarily leaving their jobs. The number of quits declined to 2.79 million from 2.93 million a month earlier. The quits rate decreased to 2%, while the rate of layoffs and discharges dropped to 1% in August from 1.3%. JOLTS is a lagging indicator, but is closely watched by the Federal Reserve and factors into decisions about interest rates and other measures. Chicago PMI Slips to 61.1 The Chicago Purchasing Managers Index (Chicago PMI) dropped slightly to 61.1 in October after jumping more than ten points to 62.4 in September but remained in positive territory for the fourth consecutive month after spending a full year below 50. However, New Orders was the only main index to post gains for the month, rising 0.2 points. All other indices declined, led by a 5.9 point drop in Production. Prices Paid was stable after jumping nearly ten points in September. Two special questions were asked in October. The first was whether respondents were planning to make working virtually a permanent option for employees. The answers revealed a high degree of uncertainty, with 45.8% being unsure, 35.6% saying no and 18.6% supporting working remotely. The second question asked if companies had reevaluated their supply chain hoping to take China out of their equation. While the majority, 47.4% had not, one third of respondents had adjusted supply chains. Looking back to when the series began in 1967, the PMI has ranged from 20.7 in June 1980 to 81.0 in November 1973. Wholesale Prices Rise 0.4% The Producer Price Index (PPI) rose 0.4% in September after rising 0.3% in August and 0.6% in July. In the 12 months through July the PPI rose 0.4%, the first positive year-over-year reading in six months. Excluding the volatile food, energy and trade services components, producer prices rose 0.4% in September and was up 0.7% year over year. The overall increase in the PPI was about twice what economists had expected but was primarily driven by prices returning to normal as the economy reopened rather than a sustained increase in inflation. The wholesale cost of goods increased 0.4%, boosted by a 14.7% increase in the price of iron and scrap. Analysts noted that while pandemic-related price distortions are reversing, the trend in inflation is expected to remain subdued for some time. Q3 GDP Soars 33.1% GDP soared at a record annualized rate of 33.1% after plunging 31.4% in the second quarter, according to the first estimate from the Commerce Department. The big increase in GDP was widely anticipated and driven by a 40.7% increase in personal consumption expenditures, which reflects the reopening of the economy. Consumer spending on goods has been much stronger than spending on services, most likely because many services involve close personal contact. Nevertheless, personal spending on services rose a solid 38.4% in Q3 after plummeting 41.8% in Q2. Other areas of strength included business spending on equipment, which jumped 70.1% and easily offset the 35.9% drop in the second quarter. Residential construction soared 59.3%, but nonresidential construction spending fell 14.6%, the fourth consecutive quarterly decline for this spending component. Growth in the fourth quarter is expected to slow sharply, with analysts predicting that GDP will grow at an annualized rate around 6%, assuming that severe CV19 restrictions are not put back in place. Analysts remain concerned that a full business recovery could take longer as the virus resurges and many business sectors remain under pressure. © Robert Bosch Tool Corporation. All rights reserved, no copying or reproducing is permitted without prior written approval.
Comments are closed.
|
|