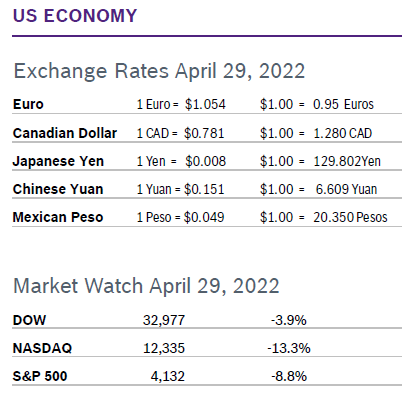
 It was another dismal month for the markets as investors grappled with strong headwinds, including monetary tightening, rising rates, persistent high inflation, the war in Ukraine and the spike in CV19 cases in China that are threatening to further disrupt the supply chain. The month was marked by big swings in both directions, but all three major indexes lost ground, with the NASDAQ posting its worst month since 2008 due to dismal results from Amazon and the S&P hitting a low point for the year. Consumer Spending Rises 1.1% Consumer spending rose 1.1% in March and spending in February was revised up to 0.6% from the 0.2% first reported. Spending was well above expectations. Spending on services rose 1.1% and spending on goods rose 1.2% as people dipped into savings to support spending. Personal income rose 0.5% in February with wages rising 0.8% and the savings rate fell to 6.2%, the lowest level since 2013, after climbing to 6.8% in February. Consumer Prices Rise 1.2% The Consumer Price Index (CPI) rose 1.2% in March after rising 0.8% in February and was up 8.5% year over year. It was the largest year-over-year increase since December 1981. Core inflation, which excludes the volatile food and energy categories, rose 0.3% in March after rising 0.5% in February and was up to a 40-year high of 6.5% year over year. However, the increase in core inflation was below economists’ expectations and the smallest increase in the core rate in six months, a sign that inflation may be peaking. The overall increase was driven by energy, food and housing. The personal consumption expenditures (PCE) price index shot up 0.9% in March, the largest gain since 2005, after climbing 0.5% in February. In the 12 months through March, the PCE jumped 6.6%. It was the largest annual gain since 1982 and followed a 6.3% year-over-year increase in February. Economists expect the increase in the annual PCE price index to start slowing in the coming months as last year's large gains drop out of the calculation. 
Chicago PMI Falls to 56.4 The Chicago Purchasing Managers Index (Chicago PMI) fell to 56.4 in April after rising to 62.9 in March. It was the 22nd consecutive month the index remained in positive territory. The reading was below expectations; economists had expected the PMI to remain steady. The PMI is 14.4 points below the reading in April 2021. A PMI number above 50 signifies expanded activity over the previous month. Looking back to when the series began in 1967, the PMI has ranged from 20.7 in June 1980 to 81.0 in November 1973. Wholesale Prices Rise 1.4% The Producer Price Index rose 1.4% in March after rising 0.8% in February and was up 11.2% year over year, the fourth consecutive record-setting monthly increase. Core inflation, which excludes the volatile food and energy categories, jumped 0.9% after rising 0.2% in February and was up 8.5% from March 2021. Energy prices accounted for about half of the increase, rising 5.7% for the month and up 36.7% from March 2020. However, prices were up across the board. The new wave of lockdowns in China and the war in Ukraine are expected to keep prices elevated. Q1 GDP Falls 1.4% Economic growth for the first quarter fell 1.4% after the economy grew at an annual rate of 6.9% in the fourth quarter of 2021. The first quarter was the weakest quarter since spring 2020 when the CV19 pandemic and related shutdowns plunged the economy into a deep, albeit short, recession. Consumer spending, the economy’s main driver, rose 2.7%, a slight acceleration from 2.5% growth in the fourth quarter. Businesses poured money into equipment and research, sending business spending soaring 9.2% The drop in GDP came from a widening trade deficit, a slower pace of business investment and fading government stimulus spending. Spending on services grew as pandemic restrictions eased and people began traveling again. However, service providers are grappling with steeply rising costs for labor and supplies. Disposable income fell for the fourth consecutive quarter. Over the last four quarters, the purchasing power of after-tax household incomes plunged by $2.2 trillion (in 2021 dollars). That's a 10.9% decline, by far the largest in the records dating back to 1947. Many economists are revising forecasts for the year and now anticipate growth around 2.6%. Over the past 75 years or 300 quarters, the annualized rate of quarterly real GDP growth has turned negative 44 times. Many negative quarters were not followed by a recession, which typically requires two negative quarters back to back. Fed Raises Rates 0.5% The Federal Reserve raised interest rates by half a point to a range of 0.75% to 1.00% at their meeting in early May. The Fed indicated they plan several more rate increases this year, and acknowledged that the war in Ukraine and other related events are creating additional upward pressure on inflation. Fed Chair Jerome Powell also said the Fed is not considering a 0.75% basis-point interest rate hike, which sent stock markets soaring. The Fed will also begin reducing its bond holdings. Yield on 10-year Treasury notes has been rising, which sends up mortgage rates. The Fed is trying to cool down the economy without sending it into a recession. © Robert Bosch Tool Corporation. All rights reserved, no copying or reproducing is permitted without prior written approval.
Comments are closed.
|
|