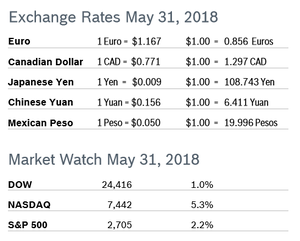
 All three indexes finished the month of May with their best gains since January and would have fared better if it had not been for international unrest and growing fears about trade wars. For the month of May, the DOW gained 1.0% to close at 24,416, the NASDAQ gained 5.3% to close at 7,442 and the S&P, the index most closely followed by economists, gained 2.2% to close at 2,705. Consumer Confidence Rises to 128.0 The New York-based Conference Board’s Consumer Confidence Index rose to 128.0 in May after April’s reading was downwardly revised to 125.6. The Present Situation Index rose to a 17-year high of 161.7 after rising to 159.6 in April. The Expectations Index rose to 105.6 in May from April’s downwardly revised 104.3. Consumers continue to perceive that labor markets are tight, with the percentage of respondents stating that jobs are “plentiful” increasing from 38.2% to 42.4%. Expectations for the future remain very positive. Economists note that a level of 90 indicates that the economy is on solid footing and a level of 100 or more indicates growth. Analysts caution that the real driver behind consumer spending is income growth and that labor market trends are a more accurate predictor of consumer behavior. Consumer Spending Rises 0.6% Consumer spending grew 0.6% in April after rising an upwardly revised 0.5% in March and was up 1.8% year over year. Core consumer spending rose 0.4% in April after increasing 0.5% in March. Personal incomes rose 0.3% in April after rising a downwardly revised 0.2% in March. The savings rate slipped to 2.8% in April after falling to 3.1% in March. A key inflation gauge rose 0.2% for the third consecutive month, leaving the PCE index, the Fed’s preferred inflation measure, up 1.8% year over year. Core PCE inflation rose at more than 2.3% over the past three months, supporting the Fed’s plans for gradual increases in interest rates. Consumer Prices Rise 0.2% The Consumer Price Index (CPI) rose 0.2% in April after falling 0.1% in March. The CPI was up 2.5% over the past twelve months. Core inflation, which excludes food and energy, rose 0.1% in April after rising 0.2% in March and was up 2.1% from April 2017. Gasoline prices rebounded 3.0% in April after tumbling 4.9% in March, and further increases are likely after crude oil prices jumped in response to the US pulling out of an international nuclear deal with Iran. Unemployment Falls to 3.8% The unemployment rate fell to 3.8% in May from 3.9% in April and the economy added a robust 223,000 new jobs after adding 164,000 new jobs in April. The unemployment rate was the lowest recorded since 2000. The number of jobs created was well above expectations. Job gains were broad based, with manufacturing adding 18,000 jobs and construction adding 25,000. The late 1960s was the last period during which the unemployment rate consistently remained below 4%. Wages rose by 2.7% after having risen by 2.6% in April. Economists said that the solid jobs report along with other economic news is evidence that the 9-year economic expansion is still moving forward and the economy is on solid footing. Durable Goods Orders Fall 1.7% Durable goods orders fell 1.7% in April after rising 2.6% in March. Economists had expected orders to fall 1.0%. Excluding the volatile transportation category, orders were up 0.9% after being flat in March. Nondefense capital goods orders excluding aircraft, widely regarded as a proxy for business spending plans, rose 1.0% in April after being downwardly revised for March. These core orders have improved to a 6.3% annual pace over the past three months, which suggests that equipment spending should continue to rise in the second quarter despite nondefense capital goods shipments, which factor into GDP, dropping 4.6% in April after falling 0.7% in March. The durable goods report is volatile and often subject to sharp revisions. Chicago PMI Rises to 62.7 The Chicago Purchasing Managers’ Index (PMI) jumped 5.1 points to 62.7 in May, the highest level for the index since January. All five components rose for the month, but the big jump was largely driven by increases in Production and New Orders, which account for 60% of the index and were 3.7% and 2.1% above their respective levels a year ago. Prices Paid remained above the 70-mark and is up more than 20% year over year. Supply constraints were negatively impacting the business of 63% of respondents, and longer delivery times and rising materials costs are eating into margins. Wholesale Prices Rise 0.1% The Producer Price Index (PPI) inched up 0.1% in April after rising 0.3% in March, continuing the upward climb in producer prices that has been going on since August 2016. The PPI was up 2.6% from April 2017. Core producer prices, which exclude food, energy and trade services, rose 0.2% in April after rising 0.3% in March and were up 2.3% compared to April 2017. The PPI for inputs to construction jumped 6.1% after rising 4.3% in March, continuing to squeeze margins for contractors. While inflation has definitely picked up, analysts say it is doing so at a manageable pace. Q1 GDP Revised Down to 2.2% GDP grew a downwardly revised 2.2% in the first quarter from the 2.3% growth first reported, according to the second reading. The slight downward revision was due to lower inventory investment and consumer spending than originally estimated. Economists had not expected any revisions. Growth in consumer spending was revised to 1.0% from the previously reported 1.1%. It was the slowest pace since the second quarter of 2013. Fourth quarter growth was robust at 4.0%. First quarter inventories increased at a $20.2 billion rate instead of the $33.1 billion first estimated, so inventory investment contributed 0.13% to GDP growth instead of 0.43%. The smaller inventory accumulation is good news for second quarter GDP growth. Business spending on equipment was revised up to 5.5% growth from the first estimate of 4.7%. Investment in homebuilding, or residential fixed investment, fell at a 2.0% pace rather than being unchanged as first reported. Job Openings Climb to Record High The number of job openings climbed to a record high of 4.2%, or 6.3 million jobs, in March, according to the Job Openings and Labor Turnover Survey, or JOLTS. Most industries saw job openings rise, with notable increases in openings in construction, which saw open jobs rise by 101,000, as well as transportation/warehousing and professional services. Over the month, hires and separations were little changed at 5.4 million and 5.3 million, respectively. Within separations, the quits rate was little changed at 2.3% and the layoffs and discharges rate was unchanged at 1.1%. The labor market is growing tighter, with just 1.0 unemployed workers per job opening. The job openings rate was 3.9%. The quits rate is considered a measure of confidence in the job market and has been steadily rising since hitting a low of 1.3% in late 2009. The JOLTS report is one of the Fed’s preferred economic indicators. © Robert Bosch Tool Corporation. All rights reserved, no copying or reproducing is permitted without prior written approval.
Comments are closed.
|
|