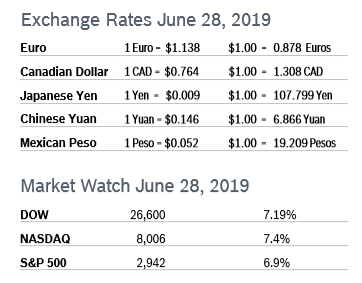
 The markets turned around in June, erasing all of May’s big losses and recording the best first half of the year since 1997. The Dow had its best June since 1938. All this despite having record-setting one-day losses over fears that a war with Iran was looming. Markets are all but certain the Fed will cut rates at its meeting in July, and hopeful that the latest round of trade talks will avert further tariffs on goods from China. Consumer Confidence Falls to 121.5 The New York-based Conference Board’s Consumer Confidence Index fell to 121.5 in June after rising to a slightly downwardly revised 131.3 in May, according to the Conference Board’s latest survey. The Present Situation Index, which is based on consumers’ assessment of current business and labor market conditions, dropped to 162.6 in June after rising to a downwardly revised 170.7 in May. The Expectations Index, which is based on consumers’ short-term outlook for income, fell to 94.1 after climbing to a downwardly revised 105.0 in May. The Conference Board stated that the declines were driven by lowered expectations for the business outlook and labor conditions and the impact of rising tensions over trade and tariffs. Economists note that a level of 90 indicates that the economy is on solid footing and a level of 100 or more indicates growth. Analysts caution that the real driver behind consumer spending is income growth and that labor market trends are a more accurate predictor of consumer behavior. Consumer Spending Rises 0.4% Consumer spending rose 0.4% May after rising an upwardly revised 0.6% in April. Core consumer spending rose 0.2% in May after rising an upwardly revised 0.2% in April. Consumer spending rose 0.9% year over year for the first quarter, the slowest quarterly growth in a year. Personal income rose 0.5% in May after rising by the same percentage in April. Savings rose to $985.4 billion in May from a downwardly revised $975 billion in May. Inflation pressures remained low, with the personal consumption expenditures (PCE) price index excluding the volatile food and energy components rising 0.2% in May after rising 0.2% in April. In the 12 months through May, the core PCE price index increased 1.5% after increasing 1.6% in April, well below the Fed’s preferred inflation reading of 2.0%. Consumer Prices Rise 0.1% The Consumer Price Index (CPI) rose a seasonally adjusted 0.1% in May after rising 0.3% in April. The year-over-year CPI was up 1.8% in May after rising 2.0% in April. Core inflation, which excludes food and energy, rose 0.1% for the eighth consecutive month. Core CPI was up 2.0% year over year, down from 2.1% in April. Fed officials worry that persistently low consumer prices could indicate slackening demand. Unemployment Rises to 3.7% The unemployment rate edged up to 3.7% in June after dropping to 3.6% in April and the economy added 224,000 new jobs, well ahead of forecasts of 170,000 jobs. The unemployment rate rose because more than 300,000 people entered the labor force looking for jobs. Unemployment remained near a 50-year low, but employment gains for May and April were revised down by a combined 11,000 jobs. The increase in hiring was widespread. Construction companies hired 21,000 new workers but retailers shed 6,000 jobs, adding to a recent string of declines in retail payrolls. The economy added an average of 172,000 new jobs a month in the first half of 2019 compared to a robust 223,000 pace in 2018. Average hourly wages for private-sector workers were unchanged at 3.1%. Wage growth has tapered off despite the tightest labor market in decades. The economy needs to create about 120,000 new jobs each month to keep up with growth in the working-age population. Durable Goods Orders Fall 1.3% Durable goods orders fell 1.3% in May after dropping a downwardly revised 2.8% in April. Much of the overall drop was due to a 28% decline in the volatile civilian aircraft component, but orders have fallen in three out of the past four months. Orders ex transportation rose 0.3% after being flat in April. Core durable goods orders for non-defense capital goods excluding aircraft, widely regarded as a key indicator of business spending, rose 0.4% after plunging a downwardly revised 1.0% in April. Nondefense capital goods shipments, which factor into GDP, rose 0.5% after falling a sharply downwardly revised 3.3% in April. The durable goods report is very volatile and often subject to sharp revisions. Chicago PMI Falls to 49.7 The Chicago Purchasing Managers’ Index (PMI) fell to 49.7 in June after rising to 54.2 in May. It was the first time the index dipped below 50 since January 2017. Demand eased off, Production fell to a three-year low and Order Backlogs remained in contraction for the second consecutive month. The special question posed to respondents in June concerned the impact of government-imposed tariffs on their business. 80% of firms said they were negatively impacted, with tariffs raising prices of their goods and leading to a pullback in orders. MNI Indicators noted that the coming months will show whether diminished business confidence is temporary and due to tariff woes or more structural, calling for some counter measures. Economists use the Chicago PMI and other regional indicators to gauge the health of the ISM manufacturing index. Wholesale Prices Rise 0.1% The Producer Price Index (PPI) rose a very slight 0.1% in May after inching up 0.2% in April and was up 1.8% year over year. Core producer prices, which exclude food, energy and trade services, rose 0.2% in May after rising 0.4% in April and were up 2.3% year over year after being up 2.2% in April 2018. Q1 GDP Unrevised at 3.1% GDP growth was unrevised at 3.1% according to the final reading in May, although it had already been revised down from the 3.2% first reported. The pace of growth in the first quarter was much stronger than the 2.2% rate of growth for the fourth quarter of 2018 but economists expect that growth slowed considerably in the second quarter. Sectors of the economy tied to trade, manufacturing and housing appear to be struggling, inflation is weak and global growth is slowing. Consumer spending for the first quarter was revised down to 0.9% from the prior estimate of 1.3% and was down sharply from 2.5% growth in the fourth quarter of 2018. Weaker consumer spending was driven by lower spending on services. Fixed nonresidential investment, a measure of business investment, was revised up from 2.3% to 4.4%. Inventory building was revised down slightly, but still contributed 0.56% to GDP growth. Consumer spending accounts for more than two-thirds of US economic activity. Job Openings Fall Slightly The number of job openings fell slightly to 7.4 million in April after rising to 7.5 million in March, according to the most recent Job Openings and Labor Turnover Survey (JOLTS). The job openings rate was unchanged at 4.7%. Hiring jumped by 240,000 jobs in April to 5.9 million, the highest level since tracking began in 2000. The hiring rate increased to 3.9% from 3.8% in March. Job openings have been fairly steady since hitting an all-time high of 7.6 million in November. The increase in hiring was concentrated in the private sector, with job openings in the construction sector increasing to 404,000 in April, a post-Great Recession high and a 57% increase from the open rate of 258,000 open construction jobs in April 2018. The construction sector hiring rate on a 12-month moving average basis increased to 5.3% in April. The number of people voluntarily quitting their jobs was little changed at 3.5 million in April, keeping the quits rate at 2.3% for 11 consecutive months. Layoffs edged up in April, with the layoff rate rising to 1.2% from 1.1% in March. Fed May Cut Rates The Fed left interest rates unchanged at a range of 2.0% to 2.25% at their meeting in mid-June but announced that they are considering a rate cut for the first time in more than a decade to give the economy a boost. Trade wars and slowing global growth are the main issues concerning the Fed, which is aiming for an inflation rate around 2%. A moderate amount of inflation is seen as a sign of a healthy economy, because as the economy grows, demand increases, which generally drives up prices and eventually wages. Very low inflation or deflation is seen as a sign of weak demand, which slows growth and depresses wages. In 1979 the Fed’s increases drove rates up to a record 20% before inflation started dropping. A string of tepid economic reports throughout the month of May led economists to forecast that the Fed will cut rates at its meeting in July. GDP Forecast S&P Global Ratings raised their forecasts for US GDP growth to 2.5% for 2019 and 1.8% for 2020 but warned that the overall odds of a recession have also increased as global trade tensions threaten the already slowing economic expansion. Their previous growth estimates were 2.2% and 1.7%, respectively. The upward revisions were due to unexpected increases in both net exports and inventory investment for the first quarter. They project that the 25% tariffs imposed on Chinese goods in May will cost the US economy an additional $60 billion, or 0.3% of GDP by the end of 2020. Growth could dip below 1% in 2020 if tariffs on the remaining $300 billion worth of Chinese imports are imposed and duties are levied on autos from the EU and goods from Mexico, according to S&P. They place the risk of a recession over the next 12 months at between 25% and 30%, up from a range of 20% to 25%, but “not enough to raise an alarm,” according to S&P. © Robert Bosch Tool Corporation. All rights reserved, no copying or reproducing is permitted without prior written approval.
Comments are closed.
|
|