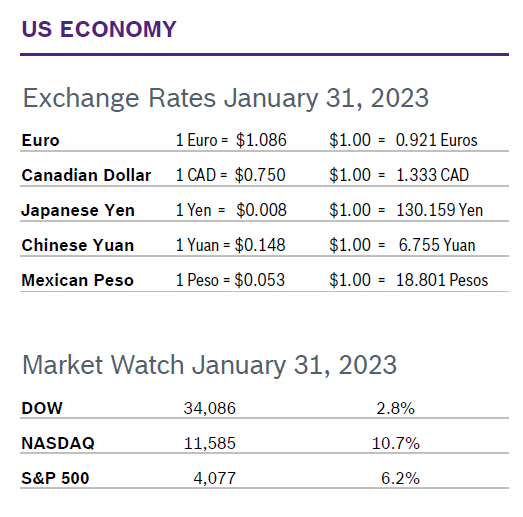
 The year got off to a solid start in the markets, with all three indexes finishing in the green and the NASDAQ having the best January since 2001. Investors were cheered by inflation cooling and signs that labor costs were easing and the Fed would slow down interest rate increases. Consumer Spending Falls 0.2% Consumer spending fell 0.2% in December and spending for November was revised down from a gain of 0.1% to a decline of 0.1%. Weakening spending may give the Fed a reason to pause or raise rates less aggressively. Spending on services rose 0.5% while spending on durable goods fell. Core consumer spending fell 0.3% in December, the biggest decline in a year, after decreasing 0.2% in November. With personal income rising 0.2%, the smallest gain since April, the outlook for spending is uncertain. Wages rose 0.3%, matching November's increase. The biggest cost of living adjustment since 1981 for more than 65 million Social Security beneficiaries took effect in January. Analysts think that may help limit the potential decline in consumer spending. Consumer Prices Fall 0.1% The Consumer Price Index (CPI) fell 0.1% in December after rising 0.1% in November and was up 6.5% year over year, down from 7.1% in November. It was the first decline in month-over-month prices since the onset of the pandemic and the seventh consecutive month that inflation fell year over year. Core inflation, which excludes the volatile food and energy categories, rose 0.3% in December after rising 0.2% in November and was up 5.7% year over year after being up 6.0% in November. Consumer Confidence Falls to 107.1 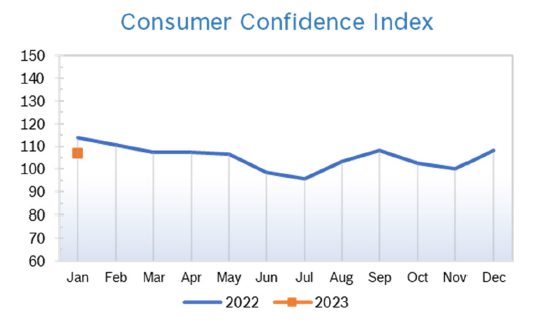
Unemployment Falls to 3.4% 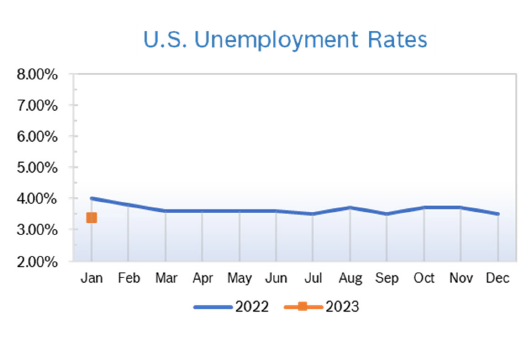
Chicago PMI Falls to 44.3 The Chicago PMI fell to 44.3 in January after rising more than seven points to 44.9 in December. The decline left the index further below 50, the level that signifies expansion. Economists had expected the PMI to rise into the 45+ range. A PMI number above 50 signifies expanded activity over the previous month; readings below 50 signify contraction. Looking back to when the series began in 1967, the PMI has ranged from 20.7 in June 1980 to 81.0 in November 1973. Wholesale Prices Fall 0.5% The Producer Price Index (PPI) fell 0.5% in December after rising 0.3% in November and was up 7.3% year over year. Falling food and gas prices led the decline. Stripping out volatile food and energy prices, core PPI rose just 0.1% in December and 5.5% year over year, down from 7.4% year over year in November. The PPI peaked at a whopping 11.7% year-over-year increase in March 2022. Q4 GDP Rises 2.9% Q4 GDP rose 2.9%, well ahead of expectations, according to the first reading from the Commerce Department. GDP rose 3.2% in the third quarter; economists had expected GDP to rise 2.3% in the fourth quarter before slowing this year. The economy got a boost last quarter from a 2.1% increase in consumer spending and the restocking of supplies by businesses. For all of 2022, GDP expanded 2.1% after growing 5.9% in 2021. The Fed's preferred gauge of inflation, the core PCE price index, eased to a 3.85% annual rate in Q4. Fed Raises Rates 0.25% The Fed raised interest rates by 0.25% February 1 to a range of 4.50% to 4.75%, the highest level since 2007. The decision followed six consecutive rate hikes of at least .50%. Comments by Fed Chair Jerome Powell noted that while inflation is falling as intended there is still a long way to go to get back into the Fed’s preferred rate of “around 2%.” Powell also indicated that the Fed has no plans to cut rates this year. The Fed’s biggest concern is a surge in wages due to the tight labor market. © Robert Bosch Tool Corporation. All rights reserved, no copying or reproducing is permitted without prior written approval.
Comments are closed.
|
|