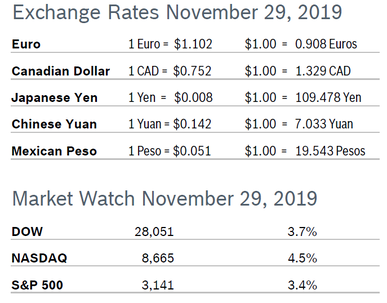
 The major indexes all posted strong monthly gains in November, driven in large part by investor optimism that a deal with China that would end the long trade war is actually in the works, and that tariffs will not increase in mid-December as scheduled. Analysts note that Black Friday week spending is a good barometer for how strong consumer spending will be over the rest of the season. Consumer Spending Rises 0.3% Consumer spending rose 0.3% in October after rising 0.2% in September. The increase beat economists expectations of a 0.2% rise. It was the eighth consecutive monthly increase for consumer spending. Much of the increase in spending in October was driven by increased spending on electricity and gas. The Commerce Department data showed household income was flat overall but wages and salaries grew at a seasonally adjusted annual rate of 0.4%, up from 0.1% in September. Wells Fargo expects consumer spending to moderate but not decline and are holding with their forecast for a 5.0% increase in holiday spending. Consumer spending accounts for more than two-thirds of US economic activity. Consumer Confidence Falls to 125.5 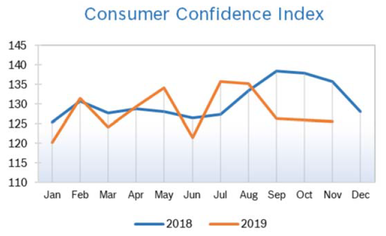
Consumer Prices Rise 0.4% The Consumer Price Index (CPI) rose 0.4% in October after being flat in September. The year-over-year CPI increase rose to 1.8% in October from 1.7% in September. Excluding the volatile food and energy categories, core prices rose 0.2% in October after rising 0.1% in September and were up 2.3% from a year ago. A 3.7% jump in gas prices accounted for half of the increase, but the cost of gas is still 7% below a year ago. The Fed’s preferred personal consumption expenditures (PCE) price index rose 0.2% in October, with PCE up 1.3% year over year. Core inflation edged up 0.1% in October and was up 1.6% year over year, well short of the Fed’s target of 2%. The core PCE index is the Fed’s preferred inflation measure. It has consistently undershot the U.S. central bank’s target of 2% this year. Unemployment Falls to 3.5% 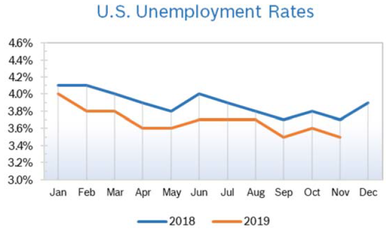
Job Openings Drop in September The number of job openings fell to 7.0 million in September from an upwardly revised 7.3 million in August and a peak of 7.6 million in November 2018, according to the most recent Job Openings and Labor Turnover Survey (JOLTS) from the U.S. Bureau of Labor Statistics. Over the month, hires rose to 5.9 million after dropping to 5.8 million in August and separations held steady at 5.8 million. Within separations, the quits rate and the layoffs and discharges rate were little changed at 2.3% and 1.3%, respectively. The quits rate is viewed by policymakers and economists as a measure of job market confidence. Chicago PMI Rises to 46.3 The Chicago Purchasing Managers’ Index (PMI) rose to 46.3 in November after falling in both September and October. However, the two-point gain was not enough to push the index over 50, the level that shows expansion, and it remained in contraction for the third consecutive month. New Orders improved the most, rising 12.5 points to 49.4 and Order Backlogs recovered and added 11.9 points to 45.0. Production slipped to 42.3 after rising to 46.8 in October. Inventories fell 8.7% to 43 and Prices Paid continued to cool, falling to 53.5 from 54.8 in October. November’s special question asked whether respondents were passing on the costs of tariffs or absorbing them. The majority (57%), said they were not passing on the costs of tariffs. The strong dollar, slowing global economy and trade disputes have curbed demand for goods made in America. Stable but softer growth in the much larger service side has been keeping the economy growing. Wholesale Prices Rise 0.4% The Producer Price Index (PPI) rose 0.4% in October after falling 0.3% in September and was up 1.1% year over year. Core producer prices, which exclude food and energy, inched up just 0.1% in October and the 12-month core rate fell to a three-year low of 1.5% in October from 1.7% in September. The wholesale cost of services rose 0.3% in October after falling 0.2% in September and the wholesale cost of goods rose 0.7% after falling 0.5% in September. About half of that increase was due to a sharp rise in prices at the pump. Q3 GDP Growth Revised Up to 2.1% Q3 GDP growth was revised up to 2.1% from 1.9%, according to the second estimate from the Commerce Department. The upward revision exceeded economists’ expectations. Consumer spending was unrevised at a 2.9% annual rate in the third quarter, down from 4.6% in the second. Business (nonresidential) fixed investment, originally reported to have fallen 3.0%, was revised to show a 2.7% decline. The upward revision reflected more inventory accumulation than originally reported and a less steep pace of contraction in business investment. Corporate pre-tax profits grew just 0.2% but rose a solid 2.7% year over year. Income growth remained strong and wages and salaries grew 3.5% at an annualized rate. Real disposable income was up a strong 2.9%, a solid underlying fundamental that points to continued economic expansion in the foreseeable future, according to Wells Fargo. Trade during the quarter was broadly neutral. Heavy industry has been hurt by the ongoing trade dispute with China, a strong US dollar and a faltering global economy. Tariff War Wages On Just before Thanksgiving, the US announced that negotiation with China are continuing, and a deal is “near.” Additional tariffs are scheduled to take affect December 15, and the waters were muddied the end of the month when President Trump signed two executive orders supporting the protestors in Hong Kong, a move the Chinese government termed “sinister.” US factory output is down nationally, and agricultural exports to China have plunged more than $10 billion since last year. © Robert Bosch Tool Corporation. All rights reserved, no copying or reproducing is permitted without prior written approval.to edit.
Comments are closed.
|
|