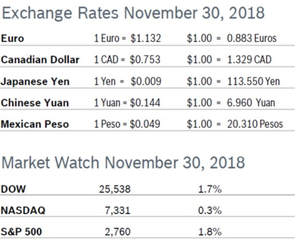
 Volatility continued throughout November, with markets posting big losses until the Fed changed the tone of their statement about interest rates and word came down that the US and China were “making progress” on trade talks at the end of the month, helping to fuel a late-month rally that saw all three indexes finishing the month with gains after big losses in October. For the month of November, the DOW gained 1.7% to close at 25,538, the NASDAQ gained 0.3% to close at 7,331 and the S&P, the index most closely watched by analysts, gained 1.8% to close at 2,760. Consumer Confidence Falls to 135.7 The New York-based Conference Board’s Consumer Confidence Index fell to 135.7 in November after rising to 137.9 in October, according to the Conference Board’s latest survey. The modest drop was due to a decline in expectations, which fell to 111.0 from 115.1 in October. Consumers became slightly less optimistic about future business conditions and personal income expectations. The Present Situation Index rose slightly to 172.7 from a downwardly revised 171.9. Economists note that a level of 90 indicates that the economy is on solid footing and a level of 100 or more indicates growth. Analysts caution that the real driver behind consumer spending is income growth and that labor market trends are a more accurate predictor of consumer behavior. Consumer Spending Rises 0.6% Consumer spending rose 0.6% in October after rising a downwardly revised 0.2% in September and 0.3% in August. It was the eighth consecutive month that consumer spending increased. Core consumer spending rose 0.4% after rising 0.3% in September. Spending on goods rose 0.5% after increasing a downwardly revised 0.1% in September and spending on services rose 0.7% after rising 0.3% in September. Personal incomes rose 0.5% after rising 0.2% in September, an indication that the tight labor market is finally producing meaningful income gains. Wages rose 0.3% after rising 0.2% in September. The savings rate dropped again. The personal consumption expenditures (PCE) price index excluding food and energy edged up 0.1% after rising 0.2% in September, dropping the annual core PCE price index to 1.8%, below the Fed’s inflation target of 2.0%. Consumer Prices Rise 0.3% The Consumer Price Index (CPI) rose 0.3% in October after edging up just 0.1% in September. The CPI was up 2.5% over the past twelve months, after being up 2.3% in September. It was the largest increase in nine months, driven by the cost of gasoline and rents. Core inflation, which excludes food and energy, rose 0.2% in October after rising 0.1% in September was up 2.1% from October 2017, down from 2.2% year over year in September. Oil prices have dropped nearly 25% since data for the CPI was gathered; economists said that overall inflation could slow accordingly, but the Fed is likely to regard any oil-driven retreat as temporary and focus on underlying price pressures. Unemployment Steady at 3.7% The unemployment rate remained at 3.7% in November for the third consecutive month and the economy added 155,000 new jobs, below expectations of 198,000 jobs. Job gains for October and September were revised down by a total of 12,000. So far this year employers have added an average of 206,000 new jobs, well ahead of the 182,000 jobs averaged in 2017. Construction companies added only 5,000 jobs after adding 24,000 in October, although that may have been in part due to more adverse weather this November. US payrolls have now grown for 98 consecutive months, by far the longest stretch of steady hiring on record. Wages grew 3.1%, matching the highest rate in nearly a decade. The unemployment rate remained unchanged at the lowest level since 1969. The economy needs to create about 120,000 new jobs each month to keep up growth in the working-age population. Durable Goods Orders Fall 4.4% Durable goods orders fell 4.4% in October to $248.52 billion after rising to an upwardly revised $260.2 billion in September. Economists had forecast a 2.5% decrease in orders. It was the biggest monthly decline since September 2017. Core durable goods orders for non-defense capital goods excluding aircraft, widely regarded as a key indicator of business spending, were flat in October after declining 0.5% in September and 0.2% in August. Nondefense capital goods shipments, which factor into GDP, fell 0.6% in October after being flat in September. The durable goods report is volatile and often subject to sharp revisions. Chicago PMI Rises to 66.4 The Chicago Purchasing Managers’ Index (PMI) jumped eight points to an 11-month high of 66.4 in November after falling to 58.4 in October, reversing three months of declines. There were increases across all five of the Barometer’s subcomponents, but New Orders, Production and Order Backlogs were the key drivers. Prices Paid moderated but remained in a historically high range. Many firms reported that supply-side issues are weighing on them, with customers negotiating prices and asking for earlier deliveries. Firms are also dealing with labor issues that are preventing them from filling backorders. Shortages and tariffs are expected to continue to push some prices higher. Wholesale Prices Rise 0.6% The Producer Price Index (PPI) rose 0.6% in October after rising 0.2% in September. The PPI was up 2.9% from October 2017, down from year-over-year price increases of 3.3% over the summer. Core producer prices, which exclude food, energy and trade services, rose 0.2% in October and were up 2.9% from October 2017. Despite the big increase, analysts say that the actual figures suggest that inflation pressures are mostly in check. Oil prices dropped, which will lower gasoline costs in the coming months. Q3 GDP Growth Unrevised at 3.5% GDP growth slowed to 3.5% in the third quarter after growing 4.2% in the second quarter. While the headline number was unrevised from the first reading, the data showed that business spending grew 2.5% in the quarter rather than the 0.85% first recorded, while consumer spending was slightly weaker, growing 3.6% in the quarter rather than the 4.0% first reported. Exports declined more than first reported, dropping 4.4%. Consumer spending, which accounts for more than two-thirds of US economic activity, rose 4.0% in the third quarter after rising 3.8% in the second quarter. Economists warned that headwinds for the economy are growing, with business spending on equipment falling to 0.4% after rising at a 4.6% pace in the second quarter. Businesses are struggling to find workers and import tariffs are increasing manufacturing costs, which will eventually result in higher costs for consumers on everything from televisions and major appliances to luggage. Higher interest rates are also pressuring the housing market, which contracted in the third quarter. Job Openings Drop The number of job openings dropped by 284,000 jobs to 7.0 million at the end of September after reaching a revised series high of 7.3 million job openings in August, according to the Job Openings and Labor Turnover Survey (JOLTS). The number of job openings fell in both government and the private sector. The number of hires was little changed at 5.7 million after reaching a revised series high of 5.9 million in August. Hires were little changed in all industries. Total separations were little changed at 5.7 million in September and the number of quits was little changed at 3.6 million. The quits rate was 2.4%. The layoffs and discharges rate was 1.1% and the number of layoffs and discharges was little changed at 1.7 million. Over the 12 months ending in September, hires totaled 67.5 million and separations totaled 65.1 million, resulting in a net employment gain of 2.5 million. Hires have outpaced separations every month since August 2010. The JOLTS report is one of the Fed’s preferred economic indicators. Fed Holds Rates Steady The Fed left interest rates unchanged at 2.0% to 2.25% at its regular meeting in early November, and at that time Fed Chairman Jerome Powell signaled that rates were “well below” neutral and that the Fed would continue to raise rates gradually amid stable economic growth. However, by the end of a month filled with market volatility, Powell changed his statement, noting that rates were now “slightly below” neutral, and sparking renewed enthusiasm on Wall Street. Powell has promised to hold a press conference after all Fed meetings beginning in January 2019. Global GDP Forecast The global economy is expected to reach annual GDP growth of 3.7% between 2018 and 2020 before slowing to 3.6% between 2021 and 2023. Global GDP will exceed the $100 billion mark around 2022, according to a Bloomberg analysis based on International Monetary Fund projections (IMF). The US share of global GDP growth is expected to drop from 12.9% today to 8.5% in 2023. China’s share of world GDP growth is expected to increase to 28.4% in 2023 from 27.2% now despite slowing growth rates in China. India’s share of global GDP growth will increase from 13% to almost 16%. Indonesia and Brazil will round out the top five. Other G7 members, including Japan, Germany, Italy and Canada, are also expected to be less important in overall GDP growth. © Robert Bosch Tool Corporation. All rights reserved, no copying or reproducing is permitted without prior written approval.
Comments are closed.
|
|