 Markets tumbled throughout much of the month as the world reeled from the growing impact of the coronavirus pandemic. Leveraged accounts and programmed trading triggered massive selloffs that continued to push markets down, wiping out virtually all of the big gains made over the past four years. The promise of a massive stimulus package towards the end of the month halted the plunge and the ensuing relief rally saw a rebound, with the DOW rising 17% and the S&P up 15.5%. Nevertheless, the DOW and the S&P turned in their worse first-quarter performances ever, losing 23.2% and 20% respectively. The DOW also had its worst overall quarter since 1987 and the S&P turned in its biggest quarterly loss since 2008. Analysts are carefully watching the market for signs of a bottom, and indications of what shape the inevitable recovery will take and when it will begin. Bear markets of all types are often punctuated by sharp bounces on the way down. Analysts are hopeful we will have a U-shaped recovery once the market finds a true bottom. Recovery may begin when new cases start to flatten out and there are projections for when the country will be able to start getting back to a more normal life. On average, it takes markets about 24 months to fully recover from a major downturn; this is impacted by many factors, including what precipitated the losses and the shape and nature of the recovery. Consumer Spending Rises 0.2% Consumer spending rose 0.2% in February after rising 0.2% in January, in line with economists’ expectations. It was the eleventh consecutive monthly increase for consumer spending. Core consumer spending rose 0.1% in February after rising 0.1% in January. Personal income jumped 0.6% for the second consecutive month, given a boost by higher wagers and government payments to farmers caught in the US-China trade war. Analysts are currently revising estimates on consumer spending, as booming spending on groceries and deliveries will not be able to offset coronavirus (CV19)-related drops in spending in many other sectors of the economy. Consumer spending accounts for more than two-thirds of US economic activity. Consumer Confidence Falls to 120 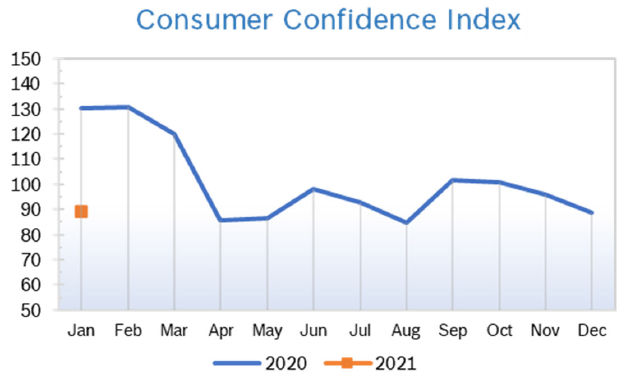
Consumer Prices Rise 0.1% The Consumer Price Index (CPI) rose 0.1% in February after rising 0.1% in January. The year-over-year increase in the CPI rose to 2.3% in February after rising to 2.5% in January. Analysts say that consumer prices may decline in the months ahead as the CV19 outbreak depresses demand for some goods and services, outweighing price increases related to shortages caused by disruptions to the supply chain. Excluding the volatile food and energy categories, core prices rose 0.2% in February after increasing by the same percentage in January. Core prices were up 2.4% from February 2019. Energy prices dropped; most of the increase in headline inflation came from increases in services and shelter costs. The PCE price index gained 0.2% in February after rising a downwardly revised 0.2% in January. The core PCE price index, the Fed’s preferred measure of inflation, has been below the target of 2% for more than a year. Unemployment Rises to 4.4% 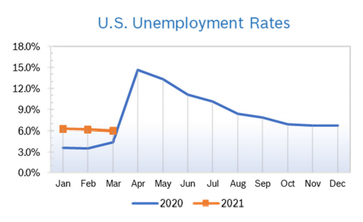
Job Openings Rise in January The number of job openings rose to 7.0 million in January after falling to 6.4 million in December, and hires and separations were little changed, according to the most recent Job Openings and Labor Turnover Survey (JOLTS) from the U.S. , which was done well before CV19 began to impact employment. Bureau of Labor Statistics. The rise in job openings came after three consecutive months of declines. Over the 12 months ending in January, hires totaled 70.0 million and separations totaled 67.9 million, yielding a net employment gain of 2.1 million. The quits rate was unchanged at 2.3% for the fifth consecutive month. The quits rate is viewed by policymakers and economists as a measure of job market confidence. Layoffs and discharges decreased in the private sector but were steady in government. Chicago PMI Falls to 47.8 The Chicago Purchasing Managers Index (Chicago PMI) fell to 47.8 in March after rising to 49.0 in February. It was the ninth consecutive sub-50 reading for the index. Among the five indicators, Production and New Orders declined; the remaining components all posted gains. Some companies reported a big increase in orders from customers who were stockpiling. Many reported that there were still delivery delays from China and other countries. The survey ran from March 2 to March 16, so answers did not reflect the full impact of CV19. Nevertheless, analysts said the barometer did not fall as much as they had anticipated. Since 2014 the index has ranged from a low of 42.0 in December 2015 to a high of 67.3 in October 2017. Looking all the way back to when the series began in 1967, the range has been from 20.7 in June 1980 to 81.0 in November 1973. Wholesale Prices Fall 0.6% The Producer Price Index (PPI) fell 0.6% in February after jumping 0.5% in January. It was the biggest decline since January 2015. In the 12 months through February the PPI was up 1.3% after being up 2.1% year over year in January. Core producer prices, which exclude food, energy and retail trade margins, dropped 0.1% in February after climbing 0.4% in January. It was the first drop in core prices since last June. Core prices were up 1.4% year over year, down slightly from a 1.5% year-over-year increase in January. Q4 GDP Growth Remains at 2.1% Q4 GDP was unrevised at 2.1%, according to the third estimate from the Commerce Department. Q4 was the third consecutive quarter GDP grew between 2% and 2.1%. There were only minor upward revisions to data. Data confirms that GDP growth in the fourth quarter was driven primarily by growth in real personal consumption expenditures (PCE), which rose 1.8%. Nonresidential fixed investment slid 2.4% and de-stocking sliced 1% off overall GDP growth. Stimulus Program Enacted Congress came together in late March to pass an unprecedented $2.2 trillion bipartisan stimulus package after days of intense negotiations, and President Trump signed the CARES Act into law the end of March. It will provide immediate relief for millions of Americans, businesses and hospitals dealing with the fallout from the coronavirus pandemic. The CARES Act, the biggest economic stimulus package in United States history, includes direct $1,200 cash payments to many Americans; $150 billion to help the healthcare industry; $500 billion for state and local governments and companies; and $350 billion in loans and assistance for small businesses. The Treasury will also make $46 billion in direct financial assistance available, including $25 billion to airlines, $17 billion for national security and $4 billion for cargo. Unemployment insurance benefits were expanded, increasing the maximum benefit by $600 per week for up to four months and extending eligibility to part-time workers, the self-employed and independent contractors. The eight weeks of assistance would be retroactive to Feb. 15, 2020 to help workers who had already been laid off. The bill also includes aid for businesses. It gives small businesses access to a nearly $350 billion loan program to cover monthly expenses like payroll, rent and utilities. The loans would not have to be repaid if businesses maintained their workforce. There’s also a financial life-line for hard-hit industries. Companies receiving assistance are prohibited from raising the pay of certain execs or buying back stock. There are also other tax relief provisions for businesses. Fed Programs to Help Economy The Federal Reserve surprised economists and slashed rates by 100 basis points on Sunday, March 15, returning rates to 0.00% to 0.25%, the interest rate that prevailed from December 2008 until December 2015. The Fed had cut rates by 50 basis points in early March. The Fed called on banks to draw on Fed facilities and use their capital and liquidity buffers to lend to households and businesses and slashed the discount rate that banks pay to a historic low of 0.25%. Banks that use the Fed’s discount window are often viewed negatively; by slashing the rate to the top of the new range for the Fed funds rate, the FOMC is removing the stigma and encouraging banks to use this facility so banks can continue to lend to households and businesses. The Fed action also lets banks know that they will not incur the wrath of regulators if they use the capital and liquidity they’ve built up over the past several years. Banking regulations and liquidity requirements were tightened after the financial crisis and downturn that began in 2007 that was eventually dubbed The Great Recession, which is why banks have more capital now. The Fed reinstated their quantitative easing program, with renewed purchases of Treasury and mortgage-backed securities. Acting in concert with other major central banks, the Fed cut the interest rate that it charges on swap lines, which foreign central banks use to borrow dollars from the Fed. © Robert Bosch Tool Corporation. All rights reserved, no copying or reproducing is permitted without prior written approval.
Comments are closed.
|
|