|
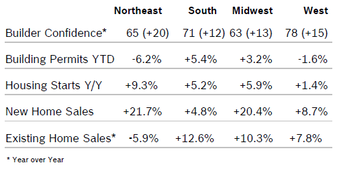
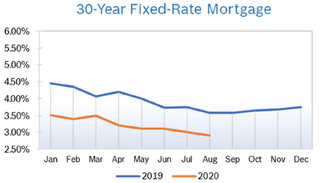
Builder Confidence Rises to 78 Builder confidence rose 6 points to 78 in August after jumping 14 points to 72 in July, according to the Association of Home Builders/Wells Fargo Housing Market Index (HMI). It was the third consecutive monthly increase for builder confidence. According to NAHB, demand remains very strong, but big increases in the cost of materials, including a 110% increase in the cost of lumber, could derail the momentum. All the HMI indices posted gains in August. The HMI index gauging current sales conditions rose six points to 84, the component measuring sales expectations in the next six months increased three points to 78 and the measure charting traffic of prospective buyers gained eight points to reach its highest level ever at 65. Regional scores all rose for the third consecutive month. Any number over 50 indicates that more builders view the component as good than do as poor. Building Permits Rise 18.8% Building permits jumped 18.8% in July to an annual rate of 1.50 million units after rising to 1.22 million units in June. Single-family permits increased 17.0% to a 983,000 unit rate, and multifamily permits rose 22.5% to a 512,000 unit pace. On a year-to-date-regional basis, permits were mixed. Housing Starts Rise 22.6% Housing starts continued to climb in July, jumping 22.6% to a seasonally adjusted annual rate of 1.50 million units after rising to 1.19 million units in June. Starts were well ahead of expectations. Single-family starts rose 8.2% to a seasonally adjusted rate of 940,000 units in July after rising to 831,000 units in June. Multifamily starts jumped 58.4% to 556,000 units after rising to 355,000 units in June. Regional starts were up year to date compared to 2019 in all regions. NAHB says demand continues to grow in lower-density areas, fueled by low interest rates and a pandemic-driven shift to the suburbs and rural areas. Among other factors, this usually means people are moving to lower-cost areas, making housing more affordable. Builders are now dealing with rising costs, including a 110% increase in the cost of lumber, which is adding an average of $14,000 to the average single-family home. New-Home Sales Rise 13.9% New-home sales rose 13.9% in July to a seasonally adjusted annual pace of 901,000 units after rising double-digits to 776,000 units in June. Sales were at a 13-year high and 36.3% ahead of July 2019. Inventory fell to a 4 months’ supply, with 299,000 new single-family homes for sale, 8.8% below the supply in July 2019 and the lowest level of inventory since 2013. The median sales price rose to $330,700 from $329,200 in June and was up from $308,300 in July 2019. New home sales rose in all four regions. Sales of new homes are tabulated when contracts are signed and are considered a more timely barometer of the housing market than purchases of previously-owned homes, which are calculated when a contract closes. Existing Home Sales Jump 24.7% Existing home sales rose 24.7% in July to a seasonally adjusted annual rate of 5.86 million after climbing to 4.72 million in June. Existing home sales were up 8.7% from July 2019 after dropping 11.3% year over year in June. The median existing-home price was $304,100, up 8.5% from July 2019, as prices rose in every region. July’s national price increase marks 101 straight months of year-over-year gains. For the first time ever, national median home prices breached the $300,000 level. Total housing inventory at the end of June was just 1.50 million units, a 3.1 months’ supply, down 2.6% from June and 21.1% from July 2019. Sales rose in every region for the second consecutive month, but year-over-year sales were mixed. With home becoming the center for more activities, people are looking for larger homes with flexible spaces, which according to NAHB should lead to continuing demand. Regional Housing Data Mortgage Rates Fall to 2.91%
© Robert Bosch Tool Corporation. All rights reserved, no copying or reproducing is permitted without prior written approval.
Comments are closed.
|
|


