|
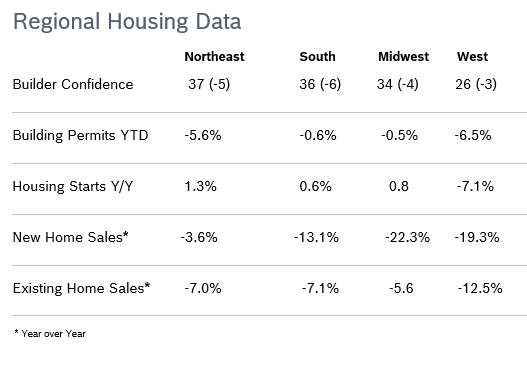
Builder Confidence Falls to 31 Builder confidence fell two points to 31 in December after falling to 33 in November, according to the National Association of Home Builders/Wells Fargo Housing Market Index (HMI). It was the 12th consecutive monthly decline for the HMI after the index hit an all-time high of 90 in November 2021. The decline left the HMI below 50 for the fifth consecutive month and was the lowest confidence reading since 2012 with the exception of the onset of the pandemic in 2020. NAHB’s latest survey showed that 62% of builders are using incentives to bolster sales, including providing mortgage rate buy-downs, paying points for buyers and offering price reductions. But with construction costs up more than 30% since inflation began to take off at the beginning of the year, there is little room for builders to cut prices. Only 35% of builders reduced homes prices in December, edging down from 36% in November. The average price reduction was 8%, up from 5% to 6% earlier in the year. Scores fell in all regions. Any number over 50 indicates that more builders view the component as good than view it as poor. Building Permits Fall 11.2% Overall building permits fell 11.2% in November to a 1.43 million unit annualized pace after falling to 1.53 million units in October. Single-family permits fell 7.1% in October to 781,000 units after falling 3.6% to 839,000 units in October. It was the eighth consecutive month single-family permits declined. Multifamily permits dropped 16.4% to an annualized pace of 561,000 units after rising to 692,000 units in October. Permits were down year to date in all regions. Housing Starts Fall 0.5% Housing starts fell 0.5% in November to a seasonally adjusted annual rate of 1.43 million units after falling to 1.44 million units in October. Single-family starts fell 4.1% to 828,000 units after falling to 855,000 units in October. Single-family starts were down 9.4% year to date and 32% since February when rates began to rise. Multifamily starts rose 4.9% to 599,000 units after dropping to 570,000 units in October. Multifamily starts are at a 50-year high but permits are dropping. Regional starts were mixed. New Home Sales Rise 5.8% New home sales rose 5.8% in November to a seasonally adjusted annual rate of 640,000 new homes after rising to 632,000 new homes in October. Sales were down 15.2% from November 2021. In November 2021, 13% of new home sales were priced below $300,000. That share has now fallen to 7%. New single-family home inventory remained elevated at an 8.6 months’ supply; a 6 months’ supply is considered balanced. The number of new homes available for sale rose 18.2% to 461,000 from November 2021. A year ago, there were just 32,000 completed, ready to occupy homes available for sale. Regional new home sales were mixed. Sales of new homes are tabulated when contracts are signed and are considered a more timely barometer of the housing market than purchases of previously owned homes, which are calculated when a contract closes. Existing Home Sales Fall 7.7% Existing home sales fell 7.7% in November to a seasonally adjusted annual rate of 4.09 million units after falling to 4.43 million units in October, according to the National Association of Realtors. It was the tenth consecutive month existing home sales fell. Sales were down 35.4% from November 2021. The inventory of unsold existing homes declined for the fourth consecutive month, falling to 1.14 million homes, a 3.3 months' supply at the current sales pace, up from 2.1 months in November 2021. The median existing house price increased 3.4% from November 2021 to $370,700.That marked 129 consecutive months of year-over-year home price increases, the longest such streak on record. However, the rate of increase is definitely slowing down. Properties remained on the market for an average of 24 days in November, up from 21 days in October. Sales were down in all regions.
© Robert Bosch Tool Corporation. All rights reserved, no copying or reproducing is permitted without prior written approval.
|
|


