|
Builder Confidence Jumps to 58 Builder confidence jumped 21 points to 58 in June after rising seven points in May, according to the Association of Home Builders/Wells Fargo Housing Market Index (HMI). According to NAHB, housing is well-positioned to lead the economic recovery. Inventory is tight, interest rates are low, mortgage applications are increasing, and confidence is picking up. Buyer traffic more than doubled from May and builders report increasing demand for single-family homes in inner and outer suburbs with lower density neighborhoods. All the HMI indices posted gains in June for the second consecutive month. The HMI index gauging current sales conditions jumped 21 points to 63, the component measuring sales expectations in the next six months rose 22 points to 68 and the component charting traffic of prospective buyers also rose 22 points, to 43. Regional scores rose in every region, with scores surging 31 points in the Northeast as states that had been shut down began to reopen. Any number over 50 indicates that more builders view the component as good than do as poor. Building Permits Rise 14.4% Building permits rose 14.4% in May to a 1.22 million unit annualized rate after falling to 1.07 million units in April. Single-family permits increased 11.9% to a 745,000 unit rate, and multifamily permits rose 18.8% to a 475,000 unit pace. On a year-to-date-regional basis, permits were mixed. Single-family permits are up almost 2% on a year-to-date basis and builders are reportedly bringing back thousands of workers laid off in March and April in order to meet renewed demand. Housing Starts Rise 4.3% Housing starts rose 4.3% in May to a seasonally adjusted annual rate of 974,000 units after falling sharply to 891,000 units in April. Single-family starts inched up 0.1% to 675,000 seasonally adjusted annual units after an upwardly revised April reading. Multifamily starts jumped 15.0% to a 299,000 pace after falling sharply in April. Regional starts were mixed. NAHB says there is an underlying long-term positivity in the housing industry that will support a rebound and housing is poised to lead the economy into recovery. New-Home Sales Rise 16.6% New-home sales rose 16.6% in May to a seasonally adjusted annual pace of 676,000 units from a downwardly revised reading in April. Sales were well above expectations and 12.7% ahead of the pace of May 2019. Sales were up 1.9% year to date. The biggest declines in sales were in the hard-hit Northeast and West. Inventory fell to a 5.6 months’ supply, with 318,000 new single-family homes for sale, 16.4% below May 2019. The number of homes completed and ready to occupy fell by 2,000 to 76,000. The median sales price rose to $317,900 from $303,900 in April and was up from $312,700 in April 2019. Regional new home sales rose in all four regions. Sales of new homes are tabulated when contracts are signed and are considered a more timely barometer of the housing market than purchases of previously-owned homes, which are calculated when a contract closes. Existing Home Sales Fall 9.7% Existing home sales fell 9.7% in May to a seasonally adjusted annual rate of 3.91 million after dropping to 4.33 million in April. Existing home sales were down 26.6% from May 2019. The National Association of Realtors (NAR) noted that May numbers reflect sales during a time when a great deal of the country was under stay-home orders, and sales should pick up in the coming months. Wells Fargo commented that the South and West accounted for the bulk of sales gains, reflecting the migration to more affordable markets. The median home price was $284,600, up 2.3% from May 2019, marking 99 consecutive months of year-over-year gains. Total housing inventory at the end of May totaled 1.55 million units, up 16.2% from April and down 18.8% from May 2019. Unsold inventory is at a 4.8-months’ supply at the current sales pace, up from 4.1 months in April and 4.3 months in May 2019. The relative weakness in condo and co-op sales, which fell 12.8% in May after plunging 26.4% in April, may reflect a potential movement away from large cities to smaller markets. It was the lowest pace of condo and co-op sales since the series began in 1999. Regional existing homes sales year over year fell in all regions. The NAR expects a slow and gradual recovery, aided by continuing low mortgage rates. Regional Housing Data 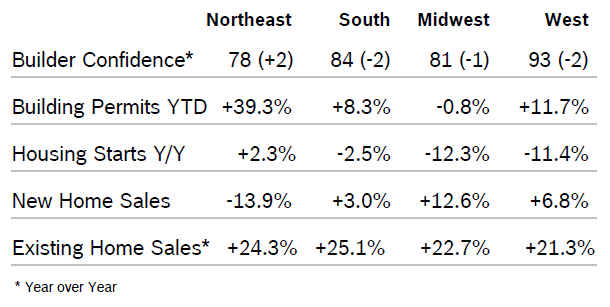 Mortgage Rates Fall to 3.13% 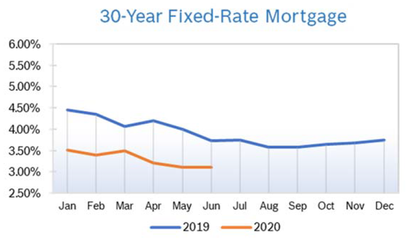
© Robert Bosch Tool Corporation. All rights reserved, no copying or reproducing is permitted without prior written approval.
|
|