|
Builder Confidence Rises to 42 Builder Confidence rose seven points to 42 in February after rising to 35 in January, according to the National Association of Home Builders/Wells Fargo Housing Market Index (HMI). All three HMI indices posted gains for the second consecutive month. Current sales conditions rose six points to 46, sales expectations in the next six months increased 11 points to 48 and the gauge measuring traffic of prospective buyers increased six points to 29. The percentage of builders reducing prices in February fell to 31% from 36% in January and 57% offered some type of incentive, down from 62% in January. Any number over 50 indicates that more builders view the component as good than view it as poor. Building Permits Rise 0.1% Overall building permits inched up 0.1% in January to a 1.34 million unit annualized pace after falling to 1.33 million units in December. Single-family permits dropped 1.8% in January to 718,000 units after falling to 730,000 units in December. It was the tenth consecutive month single-family permits declined. Multifamily permits rose 2.5% to an annualized pace of 621,000 units after falling to 600,000 units in December. Regional permits were mixed. Housing Starts Fall 4.5% Housing starts fell 4.5% in January to a seasonally adjusted annual rate of 131 million units after falling to 1.38 million units in December. Single-family starts fell 4.3% to a seasonally adjusted 841,000 units after rising to 909,000 units in December. Single-family starts were down 25% from December 2021. Multifamily starts plummeted 19% to 473,000 units after rising to 599,000 units in November. Regional starts were mixed. New Home Sales Rise 7.2% New home sales rose 7.2% in January to a seasonally adjusted annual rate of 670,000 new homes after December sales were revised up. The median sales price fell by $38,100 to $427,500 in January, 0.7% below the median price in January 2022. It was the first year over year decline in median pries since August 2020. The number of homes for sale fell 2.9% to 439,000, causing inventories to drop from an 8.7 months’ supply in December to 7.9 months in January. A 6 months’ supply is considered balanced. Sales of homes not yet started rose 72% over the month; sales of completed homes and homes under construction fell 9.1%. Builders are buying down rates and cutting prices to clear inventory. The percentage of homes priced over $500,000 fell from 43% in December to 33%. More affordable homes in the $300K to $499K price range made up 53% of all sales, up from 46% in December. Regional new home sales were mixed. Sales of new homes are tabulated when contracts are signed and are considered a more timely barometer of the housing market than purchases of previously-owned homes, which are calculated when a contract closes. Existing Home Sales Fall 0.7% Existing home sales fell 0.7% in January to a seasonally adjusted annual rate of 4.0 million units after falling to 4.02 million units in December, according to the National Association of Realtors. Sales were down 36.9% from January 2022. The inventory of unsold existing homes rose 2.1% from December 2022 to 980,000 units and was up 15.3% year over year. The increase in inventory came after five consecutive monthly declines. Unsold inventory was unchanged at a 2.9-months’ supply but was up from 1.6 months in January 2022. The median existing home price in January was $359,000, down from December but up 1.3% year over year. That marked 131 consecutive months of year-over-year home price increases, the longest running streak on record. Properties remained on the market for an average of 33 days in January. Regional sales were mixed. Regional Housing Data 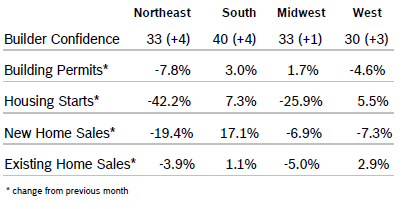 Mortgage Rates Rise to 6.5% 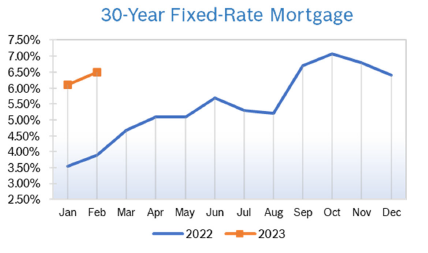
© Robert Bosch Tool Corporation. All rights reserved, no copying or reproducing is permitted without prior written approval.
|
|