|
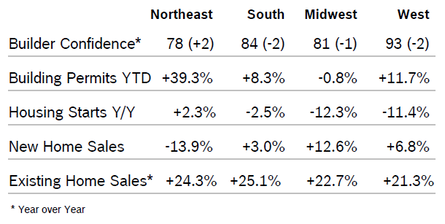
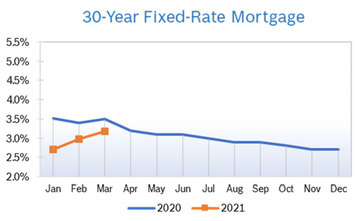
Builder Confidence Rises to 90 Builder confidence rose five points to a record-setting 90 in November after rising two points in both September and October, according to the National Association of Home Builders/Wells Fargo Housing Market Index (HMI). It was the first time the index has been above 80 for three consecutive months and the seventh consecutive monthly increase. All the HMI indices posted their highest readings ever in November. The index gauging current sales conditions rose six points to 96, the component measuring sales expectations in the next six months increased one point to 89 and the measure charting traffic of prospective buyers rose three points to 77. Regional scores all rose for the sixth consecutive month. Any number over 50 indicates that more builders view the component as good than do as poor. Building Permits Unchanged Overall building permits were unchanged in October at a seasonally adjusted annual rate of 1.55 million units. Single-family permits increased 0.6% to a 1.12 million unit rate after jumping 7.8% in September. Multifamily permits dropped 1.6% to a 425,000 unit pace. On a year-to-date regional basis, permits were mixed. Housing Starts Rise 4.9% Housing starts rose 4.9% in October to a seasonally adjusted annual rate of 1.53 million units in October after rising to 1.42 million units in September. Single-family starts rose 6.4% to a seasonally adjusted annual rate of 1.53 million units after rising to 1.1 million units in September. Single-family starts were up 8.6% year to date and remained at the highest level since spring 2007. Limited supplies of lots and building materials are keeping starts from being even higher. Multifamily starts remained stable at an upwardly revised 351,000 units after falling in September. Combined single-family and multifamily regional starts were mixed year to date compared to 2019. New-Home Sales Fall 0.3% New-home sales fell 0.3% in October to a seasonally adjusted 999,000 new homes after sales for September were revised upward by 64,000 units. Over the past four months new-home sales have risen at a faster pace than anytime since 2006. Analysts now expect new-home sales to rise a very strong 23% in 2020. Sales were up 41.5% from October 2019. Year-to-date new-home sales are up 20.6%. Inventory fell to a 3.3 months’ supply from a 3.6 months’ supply in September, 13.4% below the supply in October 2019. Of the inventory total, just 44,000 homes were completed and ready to occupy. The median sales price rose to $330,600 in October from $326,800 in September and $322,400 a year ago. NAHB noted that while demand was strong, increases in the price of lumber and other materials are driving up prices. New home sales rose in all four regions. Sales of new homes are tabulated when contracts are signed and are considered a more timely barometer of the housing market than purchases of previously-owned homes, which are calculated when a contract closes. Existing Home Sales Rise 4.3% Existing home sales rose 4.3% in October to a seasonally adjusted annual rate of 6.85 million after rising to 6.54 million in September. Existing home sales were up 26.6% from October 2019. The median existing-home price for all housing types in October rose to $313, 000 after rising to $311,800 in September and was up 16% from October 2019, as prices rose in every region. October’s national price increase marks 104 straight months of year-over-year gains. Total housing inventory at the end of October dropped to 1.42 million units, down from September and down from October 2019. Unsold inventory fell to a record-low 2.5-months’ supply from 2.7 months in September and was down from a 3.9 months’ supply in October 2019. Properties move very quickly; 72% of homes were on the market for less than a month. Sales rose month over month and year over year in every region for the fifth consecutive month. Regional Housing Data Mortgage Rates Fall to 2.7%
© Robert Bosch Tool Corporation. All rights reserved, no copying or reproducing is permitted without prior written approval.
|
|


