|
Builder Confidence Falls to 49 Builder confidence fell six points to 49 in August after dropping 12 points in July, according to the National Association of Home Builders/Wells Fargo Housing Market Index (HMI). It was the eighth consecutive month the HMI declined after hitting an all-time high of 90 last November and the first time the HMI has been below 50 since May 2020. Rising inflation, higher mortgage rates and production bottlenecks are leading to slowing traffic and shaking confidence. All three HMI components posted declines in August, with traffic of prospective buyers falling to 32, the lowest level since April 2014 with the exception of May 2020 at the beginning of the pandemic. Roughly one-in-five (19%) home builders in the HMI survey reported reducing prices in the past month to increase sales or limit cancellations. The median price reduction was 5% for those reporting using incentives. Meanwhile, 69% of builders reported higher interest rates as the reason behind falling housing demand. Scores fell in all regions. Any number over 50 indicates that more builders view the component as good than view it as poor. Building Permits Fall 1.3% Overall building permits fell 1.3% in July to a 1.67 million unit annualized rate after falling to 1.69 million units in June. Single-family permits fell 4.3% in July to 928,000 units after falling to 967,000 units in June; it was the lowest pace for single-family permits since June 2020. Multifamily permits increased 2.8% to an annualized 746,000 permits after rising to 718,000 permits in June. Regional permits were mixed year to date. Housing Starts Fall 9.6% Housing starts fell 9.6% in July to a seasonally adjusted annual rate of 1.45 million units after falling 2.0% to 1.56 million units in June. Single-family starts dropped 10.1% to 916,000 units after falling to 982,000 units in June. It was the lowest level of single-family starts since June 2020. Single-family starts are down 2.1% year to date. Multifamily starts fell 8.6% to 530,000 units after rising to 577,000 units in June. Regional starts were mixed. NAHB says higher construction costs and interest rates are leading to falling traffic for builders. New Home Sales Fall 12.6% New home sales fell 12.6% in July to a seasonally adjusted annual rate of 511,000 new homes from a downwardly revised reading in June. Sales were down 29.6% from July 2021. It was the lowest level of new home sales since January 2016. NAHB says that while the economy may not officially be in a recession, the housing market is. A combination of high prices and rising interest rates have sent many buyers to the sidelines and put a real damper on sales to first-time buyers. New single-family home inventory remained elevated at a 10.9 months’ supply, up 81.7% over last year, with 464,000 homes available for sale. However, only 45,000 of those new homes are completed and ready to occupy. The remaining have not started construction or are currently under construction. The median sales price rose to $439,400 in July, up 5.9% compared to June, and is up 8.2% compared to a year ago. The year-over-year gain peaked at 24.2% in August 2021. New home sales fell in all regions. Sales of new homes are tabulated when contracts are signed and are considered a more timely barometer of the housing market than purchases of previously-owned homes, which are calculated when a contract closes. Existing Home Sales Fall 5.9% Existing home sales fell 5.9% in July to a seasonally adjusted annual rate of 4.81 million after falling to 5.12 million units in June, according to the National Association of Realtors. It was the sixth consecutive month existing home sales fell. Sales were down 20.2% from July 2021. The inventory of existing homes rose to 1.31 million, a 3.3-months’ supply at the current sales pace, up from 3.0 months in June. The median existing home price in July fell $10,000 from June to $403,800, still up 10.8% from July 2021. This marks 125 consecutive months of year-over-year increases, the longest-running streak on record. The percentage of first-time buyers continues to fall. First-time buyers accounted for just 29% of sales in July; in a balanced market, they account for about 40% of sales. Regional Housing Data 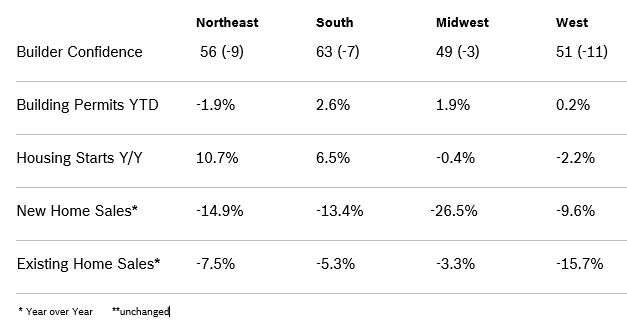 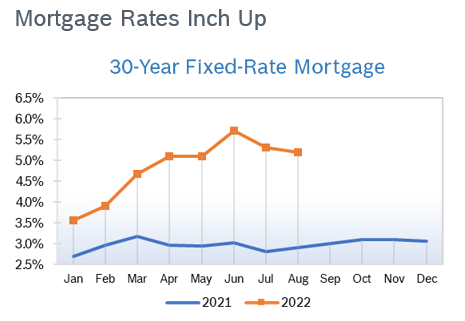
© Robert Bosch Tool Corporation. All rights reserved, no copying or reproducing is permitted without prior written approval.
|
|