|
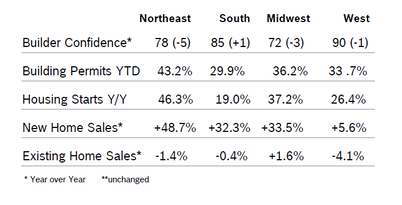
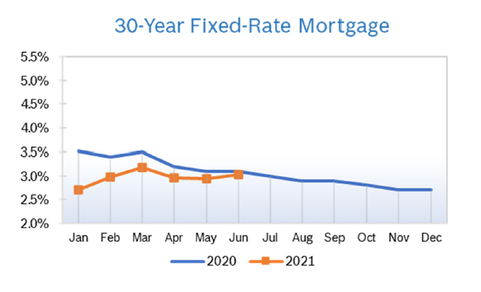
Builder Confidence Falls to 81 Builder confidence fell two points to 81 in June after holding steady in May, according to the National Association of Home Builders/Wells Fargo Housing Market Index (HMI). It was the lowest level for the index since August 2020 but was still the tenth consecutive month the index was above 80. While buyer demand remains strong, rising costs and lengthening delivery times for materials, particularly softwood lumber, are impacting sentiment and pushing many first-time and first-generation buyers to the sidelines. In addition, supply-side constraints are resulting in insufficient appraisals and also making it harder for builders to access construction loans. All three of the major indices declined in June, with current sales conditions falling two points to 86, the component measuring sales expectations in the next six months dropping two points to 79 and the gauge charting traffic of prospective buyers falling two points to 71. Regional scores were mixed for the seventh consecutive month. Any number over 50 indicates that more builders view the component as good than view it as poor. Building Permits Fall 3.0% Overall permits fell 3.0% in May to a 1.68 million unit annualized pace from downwardly revised April numbers. Single-family permits fell 1.6% in May to 1.13 million units after falling to 1.15 million units in April. Multifamily permits dropped 5.8% to a 551,000 annualized pace after falling to 567,000 units in April. Regional permits were up on a year-to-date basis. Housing Starts Rise 3.6% Housing starts rose 3.6% in May to a seasonally adjusted annual rate of 1.57 million units after numbers for April were revised downward significantly. Single-family starts rose 4.2% in May to a seasonally adjusted annual rate of 1.10 million units after falling to 1.09 million units in April. The multifamily sector, which includes apartment buildings and condos, rose 2.4% in May to 474,000 units from downwardly revised April numbers. Combined single-family and multifamily regional starts were up year to date compared to 2020. Single-family starts are expected to rise this year, but at a much slower pace than they did during 2020. New Home Sales Fall 5.9% New home sales fell 5.9% in May to a seasonally adjusted annual rate of 769,000 homes after sales for April and previous months were revised downward significantly. Inventory remains low at a 5.1-month supply, with 330,000 new single-family homes for sale, 3.8% lower than May 2020. The number of new homes sold but not yet under construction is up 76% from last year, while the number of new homes sold that are completed and ready to occupy is down 33%. About 20% of builders have limited sales activity as a way to manage supply chain issues and labor availability. Year-over-year new home sales rose in all regions. NAHB cautioned that the big jumps in year-over-year sales is due to the big slowdown in sales during the initial stages of the pandemic. Sales of new homes are tabulated when contracts are signed and are considered a more timely barometer of the housing market than purchases of previously-owned homes, which are calculated when a contract closes. Existing-Home Sales Fall 0.9% Existing-home sales fell 0.9% in May to a seasonally adjusted annual rate of 5.80 million homes after falling to 5.85 million homes in April, according to the National Association of Realtors (NAR). It was the fourth consecutive month existing home sales have declined. Lack of inventory and falling affordability are the two biggest issues impacting sales now. Sales were up 44.6% from May 2020, when they were severely impacted by the pandemic. Total housing inventory at the end of May rose 7.0% from April to 1.23 million units but was down 20.6% from May 2020. Unsold inventory sits at a 2.5-month supply at the present sales pace, marginally up from April's 2.4-month supply but down from 4.6-months in May 2020. The median existing single-family home price was $356,600 in May, up 24.4% from May 2020. It was the 111th monthly increase in year-over-year prices. Regional sales were mixed. Fannie Mae Cuts Home Sales Forecast Fannie Mae cut its forecast for home sales in the second and third quarters of 2021, and now expects 6.6 million home sales in Q2 and 6.5 million in Q3, down from previous forecasts of 6.9 million and 6.7 million, respectively. Fannie Mae blamed the drop on a lack of listings and the slowing pace of construction. Supply-side factors are limiting construction and mortgage origination. Fannie Mae noted that supply constraints are likely to persist in the near term, so upward pricing pressure may not be as transitory as many of the current factors driving inflation. Regional Housing Data Mortgage Rates Rise to 3.02%
© Robert Bosch Tool Corporation. All rights reserved, no copying or reproducing is permitted without prior written approval.
|
|


