|
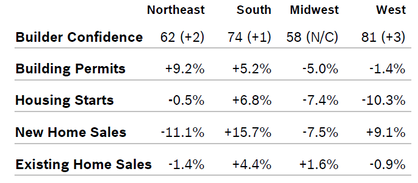
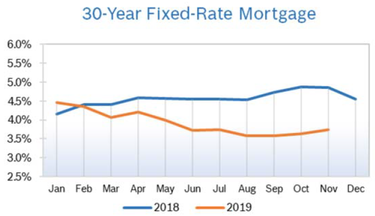
Builder Confidence Drops to 70 Builder confidence dropped one point to 70 in November after rising to 71 in October, according to the National Association of Home Builders/Wells Fargo Housing Market Index (HMI). Lot shortages, affordability issues and a chronic shortage of labor all make it harder for builders to take full advantage of the strong labor market and low mortgage rates. The HMI index gauging current sales conditions fell two points to 76 and the measure charting traffic of prospective buyers dropped one point to 53. The component measuring sales expectations in the next six months rose one point to 77. Builder Confidence rose in all regions except the Midwest. Building Permits Rise 5.0% Building permits rose 5% in October to a seasonally adjusted annual rate of 1.46 million units after falling to 1.39 million units in September. Single-family permits rose 3.2% to 909,000 annual units and multifamily permits rose 8.2% to 552,000 annual units. Regional permits were mixed. Housing Starts Rise 3.8% Housing starts rose 3.8% in October to a seasonally adjusted annual rate of 1.31 million units after falling to 1.26 million units in September. Single-family starts increased 2.0% to 936,000 units after rising to 918,000 units in September. Multifamily starts rose 8.6% to 378,000 units after falling to 338,000 units in September. The single-family market appears to be gaining momentum, according to analysis from Wells Fargo, and NAHB says that production is picking up, even though it is still below what is needed to meet demand. New-Home Sales Fall 0.7% New-home sales fell 0.7% in October to a seasonally adjusted annual rate of 733,000 units but sales for September were revised up by 37,000 units. New home sales were up a strong 9.6% from October 2018. Sales for the past two months have been at the strongest pace since 2007. Forty-five percent of new homes sold in October were priced below $300,000, an indication that more millennials are buying, according to NAHB. The inventory of new homes for sale rose slightly to 322,000 in October, a 5.3-months’ supply at the current sales pace, up slightly from September. The median sales price fell to $316,200 in October from $321,000 in September and was down from $328,300 in October 2018. Regional new home sales year to date were mixed. Sales of new homes are tabulated when contracts are signed and are considered a more timely barometer of the housing market than purchases of previously-owned homes, which are calculated when a contract closes. Existing Home Sales Rise 1.9% Existing home sales rose 1.9% in October to a seasonally adjusted annual rate of 5.46 million homes after falling to 5.38 million homes in September. Sales were up 4.6% from October 2018. Regional sales were mixed. Total housing inventory fell 2.7% in October to 1.77 million homes and was down 4.3% from October 2018. Unsold inventory is at 3.9-months’ supply at the current sales pace, down from a 4.1-months’ supply in September and a 4.3-months’ supply in October 2018. The median existing home price for all housing types in October rose 6.2% to $270,900 after falling to $272,100 in September. October was the 92nd consecutive month of increasing home prices. Regional Housing Data Mortgage Rates Fall to 3.68%
© Robert Bosch Tool Corporation. All rights reserved, no copying or reproducing is permitted without prior written approval.
|
|


