|
Builder Confidence Rises to 84 Builder confidence inched up one point to 84 in February after falling three points to 83 in January, according to the National Association of Home Builders/Wells Fargo Housing Market Index (HMI). It marked the sixth consecutive month the index was above 80. Strong buyer demand helped offset supply chain challenges and a surge in lumber prices. “Demand conditions remain solid due to demographics, low mortgage rates and the suburban shift to lower cost markets, but we expect to see some cooling in growth rates for residential construction in 2021 due to cost factors, supply chain issues and regulatory risks,” said NAHB Chief Economist Robert Dietz. “Some builders are at capacity and may not be able to expand production due to these headwinds.” The HMI index gauging current sales conditions held steady at 90, while the component measuring sales expectations in the next six months fell three points to 80. The gauge charting traffic of prospective buyers rose four points to 72. Regional scores were mixed for the third consecutive month. Any number over 50 indicates that more builders view the component as good than view it as poor. Building Permits Rise 10.4% Overall building permits rose 10.4% in January to a seasonally adjusted annual rate of 1.88 million units after rising to 1.71 million units in December. Single-family permits increased 3.8% to a 1.27 million unit rate. Multifamily permits bounced back, rising 27.2% to a 612,000 units pace. On a year-to-date regional basis, permits were mixed. Housing Starts Fall 6.0% Housing starts fell 6.0% in January to a seasonally adjusted annual rate of 1.58 million units after rising to 1.67 million units in December, which had been the highest level for starts since 2006. Single-family starts dropped 12.2% to a seasonally adjusted annual rate of 1.16 million units after rising to 1.34 million units in December. The multifamily sector, which includes apartment buildings and condos, increased 17.1% to a 418,000 pace. Combined single-family and multifamily regional starts were mixed year to date compared to 2019. The number of single-family homes permitted, but not started construction, jumped to 114,000 units in January, 9.6% higher than December and 28.1% higher than a year ago, as the cost of building materials increased and delays slowed some home building. New Home Sales Rise 4.3% New home sales rose 4.3% in January to a seasonally adjusted annual rate of 923,000 units after rising to an upwardly revised 885,000 units in December. Sales for 2020 were also revised upward, with sales climbing 19.3% to 820,000 units, the highest sales since 2006. While the number of new homes available for sale rose slightly to 307,000 homes, the sales pace fell slightly to a 4.0 month supply. The median price of a new home fell 1.9% in January to $346,400 but remains 5.3% higher than it was last January. Nearly all of the increase occurred among homes where construction had not yet begun. The inventory of new homes actually under construction fell in January and the inventory of completed homes remains near an all-time low. Wells Fargo expects new home sales to moderate throughout February and March. While home builder confidence remains strong, February brought a return of winter weather to much of the country and unusually harsh conditions to Texas, which is the nation's largest new home market. Regional new home sales were mixed. Sales of new homes are tabulated when contracts are signed and are considered a more timely barometer of the housing market than purchases of previously-owned homes, which are calculated when a contract closes. Existing-Home Sales Rise 0.6% Existing-home sales rose 0.6% in January to a seasonally-adjusted annual rate of 6.69 million, up 0.6% from upwardly revised December numbers and 23.7% from January 2020, according to the National Association of Realtors (NAR). The median existing-home sales price rose to $303,900, 14.1% higher than one year ago, as prices increased in every region. It was the 107th consecutive month that prices have increased. Housing inventory fell to a record-low of 1.04 million units, down by 25.7% year over year, a record monthly decline. The NAR also revised the previous data for 2020, incorporating updated seasonal adjustment factors as well. The net result shows sales were slightly lower than first reported but still exceptionally strong. Overall existing home sales averaged a 6.64 million-unit annual rate over the past three months, 17.7% higher than the 5.64 million-unit pace for existing homes sold in 2020. The pandemic has boosted demand for homes but has also meant that fewer homeowners are willing to put their homes on the market and go through the process of showing them. That imbalance has pushed up prices and led to bidding wars in some markets. Properties were on the market for an average of just 21 days. Regional existing-home sales for January were mixed but were up year over year in all regions. Regional Housing Data 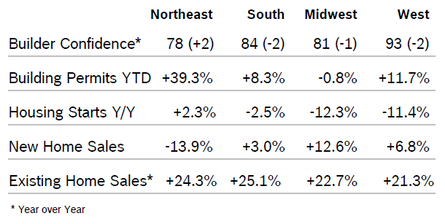 Mortgage Rates Rise to 2.97% 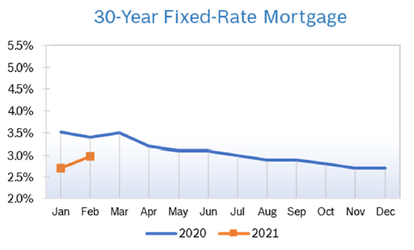
© Robert Bosch Tool Corporation. All rights reserved, no copying or reproducing is permitted without prior written approval.
|
|