|
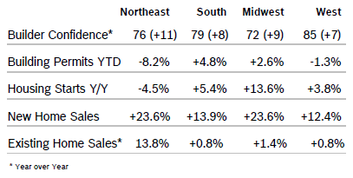
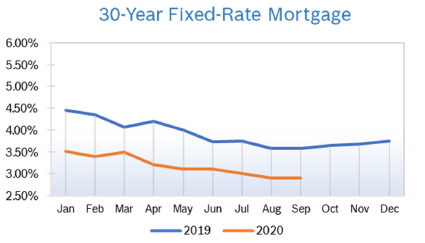
Builder Confidence Rises to 83 Builder confidence rose five points to 83 in September after rising six points in August and 14 points in July, according to the Association of Home Builders/Wells Fargo Housing Market Index (HMI). It was the highest reading for the index since December 1998 and the fourth consecutive monthly increase. According to NAHB, demand remains very strong, but big increases in the cost of materials, including a 170% increase in the cost of lumber, could derail the momentum. All the HMI indices posted their highest readings ever in September. The index gauging current sales conditions rose four points to 88, the component measuring sales expectations in the next six months increased six points to 84 and the measure charting traffic of prospective buyers rose nine points to 73. Regional scores all rose for the fourth consecutive month. Any number over 50 indicates that more builders view the component as good than do as poor. Building Permits Fall 0.9% Building permits fell 0.9% in August to an annual rate of 1.47 million units after rising to 1.50 million units in July. Single-family permits rose 6.0% to a 1.04 million unit rate and multifamily permits dropped 14.2% to a 434,000 unit rate. On a year-to-date regional basis, permits were mixed. Housing Starts Fall 5.1% Housing starts fell 5.1% in August to a seasonally adjusted annual rate of 1.42 million units after jumping to 1.50 million units in July. Single-family starts rose 4.1% to a seasonally adjusted rate of 1.02 million units after rising to 940,000 units in July. Multifamily starts dropped 22.7% to 395,000 units after jumping to 556,000 units in July. Regional starts were mixed year to date compared to 2019. New-Home Sales Rise 4.8% New-home sales rose 4.8% in August to a seasonally adjusted annual pace of 1.01 million after rising to 901,000 units in July. Sales were at the highest pace since 2006 and 43.2% ahead of sales in August 2019. Inventory fell to a 3.3 months’ supply, with 282,000 new single-family homes for sale, 40% below the supply in August 2019 and the lowest level of inventory from data going back to 1963. Of the inventory total, just 54,000 were completed and ready to occupy. The median sales price fell to $312,800 from $330,700 in July and $327,000 a year ago. New home sales rose in all four regions. Sales of new homes are tabulated when contracts are signed and are considered a more timely barometer of the housing market than purchases of previously-owned homes, which are calculated when a contract closes. Existing Home Sales Rise 2.4% Existing home sales rose 2.4% in August to a seasonally adjusted annual rate of 6.0 million after climbing to 5.86 million in July. Existing home sales were up 8.7% from July 2019 after being down 11.3% year over year in June. The median existing-home price was $310,600, up 11.4% from August 2019, marking 102 consecutive months of year-over-year gains. Total housing inventory at the end of August was 1.49 million units, a 3.0 months’ supply, down 0.7% from July and 18.6% from August 2019. Properties were on the market an average of just 22 days. For the third consecutive month, sales rose in every region. Sales also rose year over year in every region. With home becoming the center for more activities, people are looking for larger homes with flexible spaces. According to NAHB, that should lead to demand that will continue to outstrip supply, which may lead to further escalating prices. Regional Housing Data September Mortgage Rates Stable at 2.9%
© Robert Bosch Tool Corporation. All rights reserved, no copying or reproducing is permitted without prior written approval.
Comments are closed.
|
|


