|
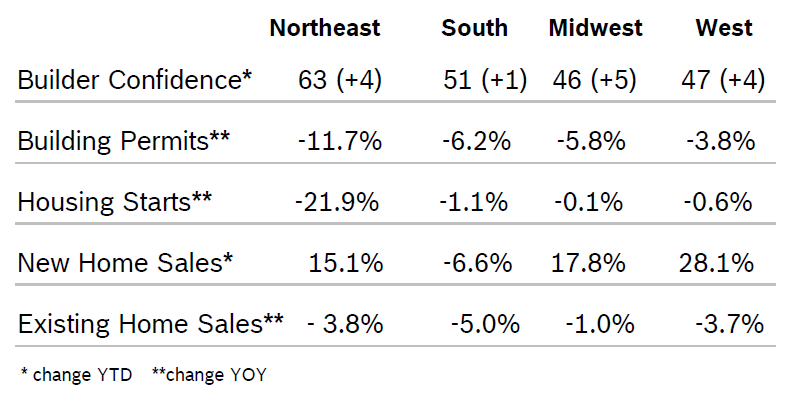
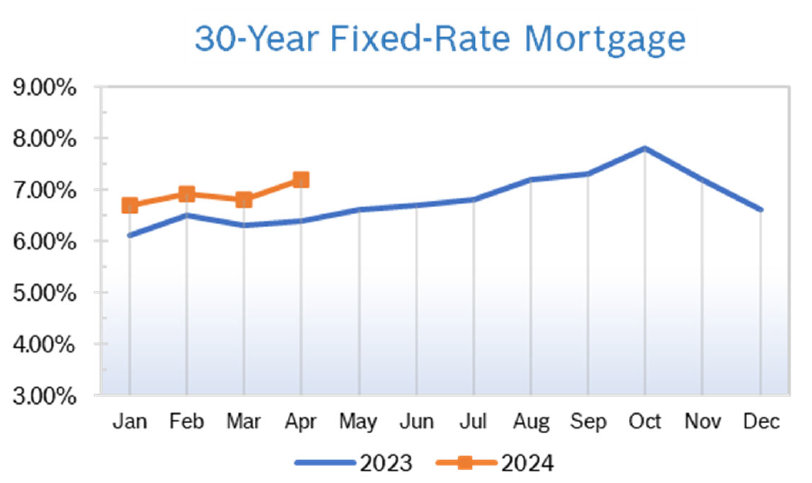
Builder Confidence Steady at 51 Builder Confidence held steady at 51 in April, according to the National Association of Home Builders/Wells Fargo Housing Market Index (HMI). The HMI index charting current sales conditions in April increased one point to 57 and the component gauging traffic of prospective buyers also increased one point to 35. The component measuring sales expectations in the next six months fell two points to 60. Confidence rose in all regions for the third consecutive month. Any number over 50 indicates that more builders have a positive outlook than a negative one. Building Permits Fall 4.3% Overall building permits fell 4.3% in March to 1.46 million units after rising to 1.52 million units in February. Single-family permits fell 4.7% to 973,000 units after rising to 1.03 million units in March. Multifamily permits fell 1.2% to 485,000 annual units after rising to 487,000 annual units in February. Regional permit issuance was mixed. Housing Starts Fall 14.7% Housing starts fell 14.7% in March to a seasonally adjusted annual rate of 1.32 million units after rising to 1.52 million units in February. Single-family starts fell 12.4% to a seasonally adjusted annual rate of 1.022 million units after rising to an upwardly revised 1.67 million units in February. Single-family starts were up 22.0% from March 2023. Multifamily starts, which include apartment buildings and condos, rose 8.3% to an annualized 392,000 pace. Multifamily starts are typically very volatile. New Home Sales Rise 8.8% New home sales bounced back in March, rising 8.8% to a seasonally adjusted annual rate of 693,00 homes from downwardly revised February numbers, according to the National Association of Home Builders (NAHB). Sales were up 8.3% from March 2023. New single-family home inventory remained high at 477,000 homes, up 2.6% from February and an 8.3 months’ supply at the current building pace; a 6 months’ supply is considered normal. Inventory of newly-built single-family homes is up 10.2% on a year-over-year basis. The median new home sale price in March was $430,700, up nearly 6% from February but down 1.9% compared to a year ago. Regional new home sales were mixed. Sales of new homes are tabulated when contracts are signed and are considered a more timely barometer of the housing market than purchases of previously-owned homes, which are calculated when a contract closes. Existing Home Sales Fall 4.3% Existing home sales fell 4.3% in March to a seasonally adjusted annual rate of 4.19 million units after jumping to 4.38 million units in February, according to the National Association of Realtors. Sales were down 3.7% from March 2023. The decline in existing home sales was widely expected and came after two months of robust gains due to lower mortgage rates and increased supplies. The median existing home sales price rose 4.8% year over year to $393,500, leaving year-over-year prices below $400,000 for the seventh consecutive month. It was the ninth consecutive month existing home sales prices have risen. The inventory of unsold existing homes rose 4.7% to 1.11 million homes, a 3.2-months’ supply at the current sales pace, up from 2.9 months in February. A chronic shortage of existing inventory continues to spur new home construction and sales despite high prices. Existing home sales were down year-over-year in all regions. Regional Housing Data Mortgage Rates Rise to 7.2%
© Robert Bosch Tool Corporation. All rights reserved, no copying or reproducing is permitted without prior written approval.
Comments are closed.
|
|


