|
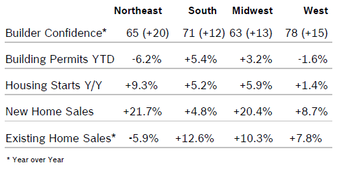
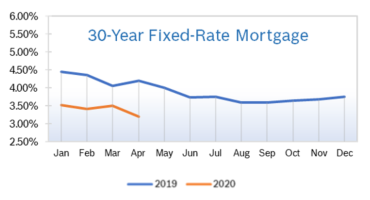
Builder Confidence Plunges to 30 Builder confidence dropped 42 points to 30 in April after sliding just two points to 72 in March, according to the National Association of Home Builders/Wells Fargo Housing Market Index (HMI). It was the largest single-month decline in the index on record, and marks the lowest level of confidence since June 2012, when tax breaks for first-time homebuyers ended. It was the first time builder confidence has been below 50 since June 2014. The HMI index charting current sales conditions dropped 43 points to 36, the index gauging sales expectations in the next six months fell 39 points to 36 and the index measuring traffic of prospective buyers fell 43 points to 13. The drop was due exclusively to the CV19 outbreak, as unemployment has skyrocketed and gaps in the supply chain are hampering construction activities, according to NAHB. In addition, there is some confusion over builder eligibility for the Paycheck Protection Program (PPP) as some builders have successfully applied for these loans that can ultimately be forgiven, while others have been denied. The three-month moving average for builder confidence fell in all regions. Building Permits Fall 6.8% Building permits fell 6.8% in March to a seasonally adjusted annual rate of 1.35 million after falling to 1.46 million units in February. Single-family permits fell 12% to 884,000 units in March after rising to one million annual units in February. Multifamily permits rose 4.9% to 469,000 after dropping to 460,000 units in February. Year-to-date permits rose in all regions. Housing Starts Fall 22.3% Housing starts fell 22.3% in March to a seasonally adjusted annual rate of 1.22 million units after falling to 1.60 million units in February. Single-family starts fell 17.5% to 856,000 annual units after rising to 1.07 million units in February. Multifamily starts fell 31.7% to 360,000 units after falling to 527,000 units in February. Housing starts fell in all regions. The declines were largely in line with expectations, as builders know demand will be impacted by the spike in unemployment and the big drop in economic activity. NAHB expects April starts to decline further based on the dizzying drops in builder and consumer confidence. NAHB Chief Economist Robert Dietz said, “It is worth noting that there are currently 534,000 single-family homes currently under construction and 684,000 apartments. Approximately 90% of these single-family units are located in states where home building is deemed as an ‘essential service,’ while 80% of apartments are located in such states.” Builders are also bracing for a wave of contract cancellations due to people being unexpectedly out of work. New-Home Sales Fall 15.4% New-home sales fell 15.4% in March to a seasonally adjusted annual rate of 627,000 units from downwardly revised February numbers. Sales were 9.5% below March 2019. Sales for the first quarter as a whole were up 6.7% from Q1 2019. The biggest declines in sales were in the hard-hit Northeast and West. NAHB expects the pace to slow further in April before stabilizing later this year. The inventory of new homes for sale rose to 333,000, a 6.4 months’ supply at the current sales pace, 1.2% lower than March 2019. However, only 76,000 of those homes were completed and ready to occupy in March; the rest are under construction. The median sales price was $321,400, up from $310,600 in March 2019. New home sales were down in all regions. Sales of new homes are tabulated when contracts are signed and are considered a more timely barometer of the housing market than purchases of previously-owned homes, which are calculated when a contract closes. Existing Home Sales Fall 8.5% Existing home sales fell 8.5% in March to a seasonally adjusted annual rate of 5.27 million after rising to 5.77 million homes in February. Existing home sales were up 0.8% from March 2019. The median home price rose 8% from March 2019 to $280,600, marking 97 consecutive months of year-over-year gains. Total housing inventory at the end of March rose 2.7% to 1.50 million units but was down 10.2% from March 2019. Unsold inventory inched up to a 3.4-months’ supply from 3.1-months in February but was down from a 3.8-months’ supply in March 2019. Regional existing homes sales year over year fell in all regions. NAR noted that 25% of realtors with clients writing contracts had at least one who purchased sight unseen, relying on virtual tours, familiarity with the area and their realtors recommendation. Regional Housing Data March 2020 Mortgage Rates Fall to 3.23%
NAHB Debuts New Remodeling Index The first reading of NAHB’s newly redesigned Remodeling Market Index (RMI) was 48. The redesign is intended to make response easier and better track and interpret industry trends. The new RMI survey asks remodelers to rate five components of the remodeling market as “good,” “fair” or “poor.” Each question is measured on a scale from 0 to 100, where an index number above 50 indicates that a higher share view conditions as good than do as poor. Overall, remodelers are being impacted by CV19, as even homeowners who have not lost their jobs are often working from home, trying to home school their children and wary about having crews of people working in their homes. The Current Conditions Index is an average of three of the five components: the current market for large remodeling projects, moderately-sized projects and small projects. The Future Indicator Index is an average of the other two components: the current rate at which leads and inquiries are coming in and the current backlog of remodeling projects. The overall RMI is calculated by averaging the Current Conditions Index and the Future Indicator Index. Any number over 50 indicates that more remodelers view remodeling market conditions as good than view conditions as poor. The Current Conditions Index averaged 58, with large remodeling projects ($50,000 or more) yielding a reading of 53, moderately-sized remodeling projects (at least $20,000 but less than $50,000) at 59 and small remodeling projects (under $20,000) with a reading of 62. The Future Indicator Index averaged 39, with the rate at which leads and inquiries are coming in at 30 and the backlog of remodeling jobs at 47. Because the previous RMI series can no longer be used to compare with this quarter’s results, the redesigned tool asked remodelers to compare market conditions in their areas to three months earlier, using a “better,” “about the same” or “worse” scale. This index posted a reading of 24, indicating that many more remodelers thought conditions had become worse in the first quarter than thought they had become better. This low reading can be attributed directly to CV19. © Robert Bosch Tool Corporation. All rights reserved, no copying or reproducing is permitted without prior written approval.
Comments are closed.
|
|


