|
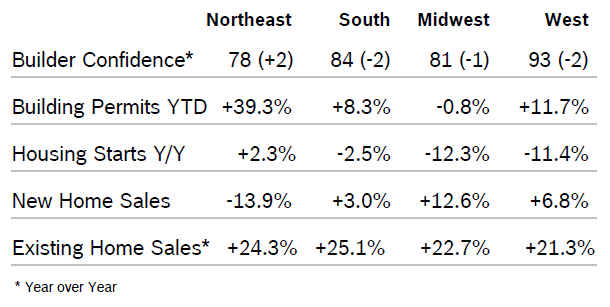
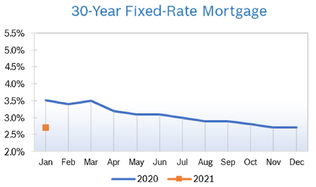
Builder Confidence Falls to 74 Builder confidence dropped one point to 74 in February after dropping one point to 75 in January, according to the National Association of Home Builders/Wells Fargo Housing Market Index (HMI). The HMI index charting current sales conditions fell one point to 80, the index gauging sales expectations in the next six months fell one point to 79 and the index measuring traffic of prospective buyers dropped one point to 57. Despite the decline, the last three months mark the highest levels of builder confidence since December 2017. The three-month moving average for builder confidence rose in all regions except the West, where it fell one point. Building Permits Rise 9.2% Building permits rose 9.2% in January to a seasonally adjusted annual rate of 1.55 million units, the highest level since March 2007. Single-family permits rose 6.4% to 987,000 annual units after falling to 916,000 units in December. Multifamily permits rose 14.6% to 564,000 units after falling to 500,000 units in December. Permits rose in all regions on a year-to-date basis. Housing Starts Fall 3.6% Housing starts fell 3.6% in January to a seasonally adjusted annual rate of 1.57 million units and starts for December were adjusted upwards. Single-family starts dropped 5.9% to 1.01 million units after rising to 1.06 annual units in December. Multifamily starts rose 0.7% in January to 557,000 units after rising to 553,000 units in December. Regional housing starts were mixed. Even though January starts fell, the pace was the second-strongest since the housing recovery began. New-Home Sales Rise 7.9% New-home sales rose 7.9% in January to a seasonally adjusted annual rate of 764,000 new homes after sales for December were revised upwards. Sales were up 18.6% from January 2019 and at the highest monthly pace since July 2007. The inventory of new homes for sale fell to a 5.1-months’ supply at the current sales pace from 5.7 months in December. Supplies were down 6.6% from January 2019. The median sales price rose to $348,200 in January from $331,400 in December and $305,400 in January 2019. Regional new home sales year to date were mixed. Sales of new homes are tabulated when contracts are signed and are considered a more timely barometer of the housing market than purchases of previously-owned homes, which are calculated when a contract closes. Existing Home Sales Fall 1.3% Existing home sales fell 1.3% in January to a seasonally adjusted annual rate of 5.46 million homes after rising to 5.4 million homes in December. Existing home sales were up 9.6% from January 2019. The median home price rose 6.8% from January 2019 to $266,300, marking 95 consecutive months of year-over-year gains. Total housing inventory at the end of January rose 2.2% from December to 1.42 million units but was down 10.7% from January 2019. Unsold inventory was at a 3.1-months’ supply at the current sales pace, up from 3.0 months in December but down from 3.8 months in January 2019. Regional existing homes sales year over year were up in all regions; regional sales compared to December 2019 were mixed. Regional Housing Data YTD Mortgage Rates Fall to 3.45%
© Robert Bosch Tool Corporation. All rights reserved, no copying or reproducing is permitted without prior written approval.
Comments are closed.
|
|


