|
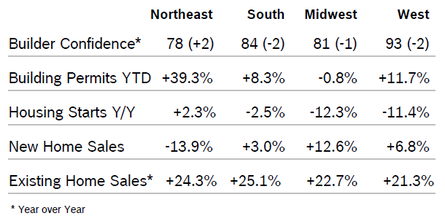
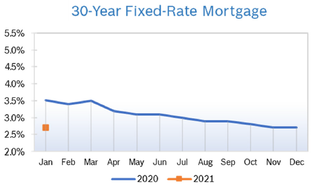
Builder Confidence Falls to 83 Builder confidence fell three points to 83 in January after dropping four points to 86 in December, according to the National Association of Home Builders/Wells Fargo Housing Market Index (HMI). It was the first time the index was above 80 for five consecutive months. Rising materials costs led by a huge upsurge in lumber prices along with a resurgence of CV19 across much of the nation were behind the decline. All three major HMI indices fell in January. The index gauging current sales conditions dropped two points to 90, sales expectations in the next six months fell two points to 83 and the gauge charting traffic of prospective buyers decreased five points to 68. Regional scores were mixed for the second consecutive month. Any number over 50 indicates that more builders view the component as good than view it as poor. Building Permits Rise 4.5% Overall building permits rose 4.5% in December to a seasonally adjusted annual rate of 1.71 million units after rising to 1.64 million units in November. Single-family permits increased 7.8% to a 1.23 million unit rate. Multifamily permits dropped 3.8% to 483,000 units. On a year-to-date regional basis, permits were mixed. Housing Starts Rise 5.8% Housing starts rose 5.8% in December to a seasonally adjusted annual rate of 1.67 million units after rising to a seasonally adjusted annual rate of 1.55 million units in November. Single-family starts rose 12.0% to a seasonally adjusted annual rate of 1.34 million units after rising to 1.19 million units in November. December starts were the highest since 2006. Total housing starts for 2020 were 1.38 million, up 7.0% from 2019. Single-family starts in 2020 totaled 991,000, up 11.7% from the previous year. Multifamily starts totaled 389,000, down 3.3% from the previous year. Combined single-family and multifamily regional starts were mixed year to date compared to 2019. New Home Sales Rise 1.6% New home sales rose 1.6% in December to a seasonally adjusted annual rate of 842,000 units after falling to 841,000 units in November. Sales for 2020 totaled 811,000 units, up 18.8% from 2019 and the highest sales since 2006. Inventory rose slightly to 302,000 homes, a 4.3 months’ supply, but all of the increase came from homes still under construction or not yet begun. Inventory was 18.3% below December 2019. The inventory of completed homes ready to sell remained at an all-time low. The median sales price rose to $355,900, up 8% year over year. Wells Fargo noted that the acceleration in new home prices is being fueled by strong demand for larger and more expensive homes loaded with amenities because home is now also workplace and school, and often several generations are sharing one home. Construction costs have also ramped up, as lumber prices have soared and shortages of other key materials have made it more difficult to profitably build lower-priced homes. These factors are fueling growth in lower-cost, lower- density regions. Regional new home sales were mixed. Sales of new homes are tabulated when contracts are signed and are considered a more timely barometer of the housing market than purchases of previously-owned homes, which are calculated when a contract closes. Existing-Home Sales Rise 0.7% Existing-home sales rose 0.7% in December to a seasonally adjusted annual rate of 6.76 million units after falling to 6.69 million units in November. It was the highest rate of sales since 2006. Existing-home sales were up 22.2% from December 2019. The median existing-home price for all housing types in December was $309,800, up 12.9% from December 2019. December’s national price increase marks 106 consecutive months of year-over-year gains. Total housing inventory at the end of December fell to a record-low of 1.07 million homes, down from 1.28 million homes in November. Unsold inventory was at an all-time low 1.9-months supply at the current sales pace, down from 2.3 months in November and down from the 3.0 months in December 2019. The pandemic has boosted demand for homes but has also meant that fewer homeowners are willing to put their homes on the market and go through the process of showing them. That imbalance has pushed up prices and led to bidding wars in some markets. Properties were on the market for an average of just 21 days. Regional existing-home sales for December were mixed, but were up year over year in all regions. Remodeling Index at 79 NAHB’s Remodeling Market Index (RMI) for the fourth quarter of 2020 posted a reading of 79, signaling residential remodelers’ strong confidence in projects of all sizes. The remodeling market was healthy in 2020, but slowed a bit at the end of the year due to rising CV19 cases and economic uncertainty about the future. In the fourth quarter, all components and subcomponents of the RMI were 71 or above. The Current Conditions Index averaged 85, with large remodeling projects ($50,000 or more) at 78, moderately sized remodeling projects ($20,000 to $50,000) at 88 and small remodeling projects (under $20,000) at 89, strong readings for projects of all sizes. The Future Indicators Index averaged 72, with leads and inquiries at 71 and the backlog of remodeling jobs at 73. Because the Remodeling Index was redesigned in 2020 to make it easier to respond to and more accurately reflect industry trends, it cannot be compared to previous RMI readings. So in order to track quarterly trends, the redesigned RMI survey asks remodelers to compare market conditions to three months earlier, using a ‘better,’ ‘about the same,’ ‘worse’ scale. In the fourth quarter, 68% indicated conditions were the same as in the third quarter, 21% said they were better and 11% thought conditions were worse. Regional Housing Data Mortgage Rates Steady at 2.7%
© Robert Bosch Tool Corporation. All rights reserved, no copying or reproducing is permitted without prior written approval.
Comments are closed.
|
|


