|
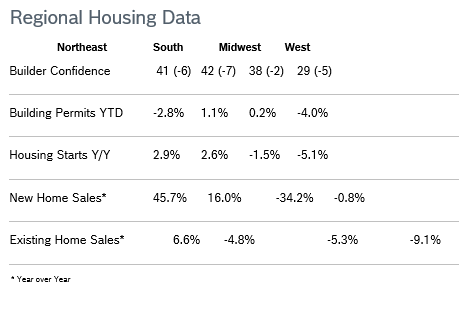
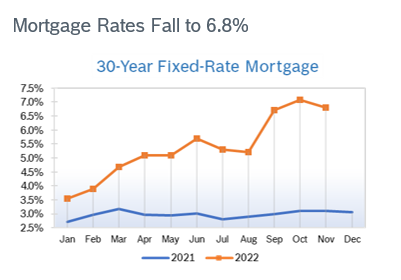
Builder Confidence Falls to 33 Builder confidence fell five points to 33 in November after dropping to 38 in October, according to the National Association of Home Builders/Wells Fargo Housing Market Index (HMI). It was the eleventh consecutive monthly decline for the HMI after the index hit an all-time high of 90 in November 2021. The decline left the HMI below 50 for the fourth consecutive month and was the lowest confidence reading since 2012 with the exception of the onset of the pandemic in 2020. To bring more buyers into the marketplace, 59% of builders report using incentives, with a big increase in usage from September to November. For example, in November, 25% of builders say they are paying points for buyers, up from 13% in September. Mortgage rate buy-downs rose from 19% to 27% over the same time frame. And 37% of builders cut prices in November, up from 26% in September, with an average price of reduction of 6%. This is still far below the 10% to 12% price cuts seen during the Great Recession in 2008. All three HMI components posted declines in November. Current sales conditions fell six points to 39, sales expectations in the next six months declined four points to 31 and traffic of prospective buyers fell five points to 20. Scores fell in all regions. Any number over 50 indicates that more builders view the component as good than view it as poor. Building Permits Fall 2.4% Overall building permits fell 2.4% in October to a 1.53 million unit annualized pace after rising to 1.56 million units in September. Single-family permits fell 3.6% in October to 839,000 units after falling to 872,000 units in September. It was the lowest reading for single-family permits since June 2020 and marked the seventh consecutive month single-family permits have declined. Multifamily permits rose 7.8% to an annualized pace of 692,000 units. Regional permits were mixed year to date. Housing Starts Fall 4.2% Housing starts fell 4.2% in October to a seasonally adjusted annual rate of 1.43 million units after falling to 1.44 million units in October. Single-family starts fell 6.1% to 855,000 units after falling to 892,000 units in September and were down 7.1% year to date. Multifamily starts fell 1.2% to 570,000 units after dropping in double-digits in September. Regional starts were mixed. New Home Sales Rise 7.5% New home sales rose 7.5% in October to a seasonally adjusted annual rate of 632,000 new homes after falling to a downwardly revised 588,000 new homes in September. Sales were down 5.8% from October 2021 after being down 17.6% year over year in September. There were 468,000 new homes on the market at the end of October, a 9.2-months’ supply at the current sales pace and up from 463,000 units in September. Houses under construction accounted for 63.4% of the inventory, with 23.6% of the homes not yet started. The median new home price was $493,000, up 15.4% from October 2021. Regional new home sales were mixed. Sales of new homes are tabulated when contracts are signed and are considered a more timely barometer of the housing market than purchases of previously-owned homes, which are calculated when a contract closes. Existing Home Sales Fall 5.8% Existing home sales fell 5.8% in October to a seasonally adjusted annual rate of 4.43 million units after falling to 4.71 million units in September, according to the National Association of Realtors. It was the ninth consecutive month existing home sales fell. Sales were down 28.4% from October 2021. The inventory of unsold existing homes declined for the third consecutive month, falling to 1.22 million homes, a 3.3 months' supply at the current sales pace. The median existing house price increased 6.6% from October 2021 to $379,100. That marked 128 consecutive months of year-over-year home price increases, the longest such streak on record. There were 1.22 million previously owned homes on the market, down 0.8% from both September 2022 and October 2021. Inventory was at a 3.3- months’ supply, up from 2.4 months a year ago. A four-to-seven-months’ supply is viewed as a healthy balance between supply and demand. Properties typically remained on the market for 21 days in October, up from 19 days in September. Sixty-four percent of homes sold in October 2022 were on the market for less than a month. Regional sales were mixed.
© Robert Bosch Tool Corporation. All rights reserved, no copying or reproducing is permitted without prior written approval.
Comments are closed.
|
|


